A screen flow can show records and it cannot add them up. Here is how the Pivot Table computes the totals on the screen itself, and lets the reviewer open any number to fix what is inside it.
A screen flow can show somebody records. It cannot add them up. Flow has no aggregate query, no GROUP BY and no Sum element, so a screen that ought to open on "here is the shape of it, before you decide" gets built out of a Get Records, a loop and one number variable per total. Or it does not get built, and the person running the flow is sent off to a report in another tab, which is the moment the flow stops being where the work happens.
That gap closed on 10 July. The Pivot Table had been a Dynamic Components exclusive; Flow Screen Components 6.30.0 put it on the screen palette, which puts the aggregate where the flow already is.
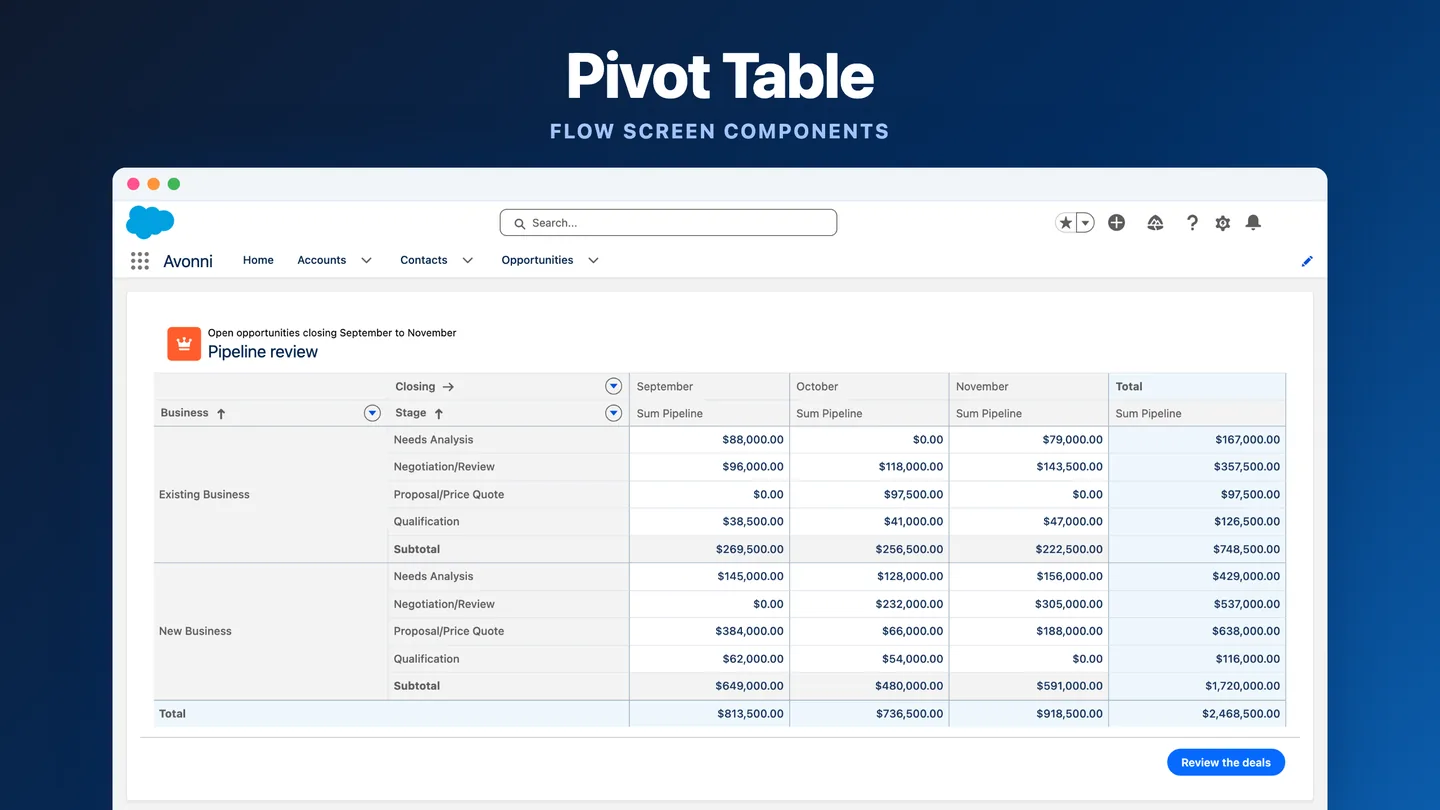
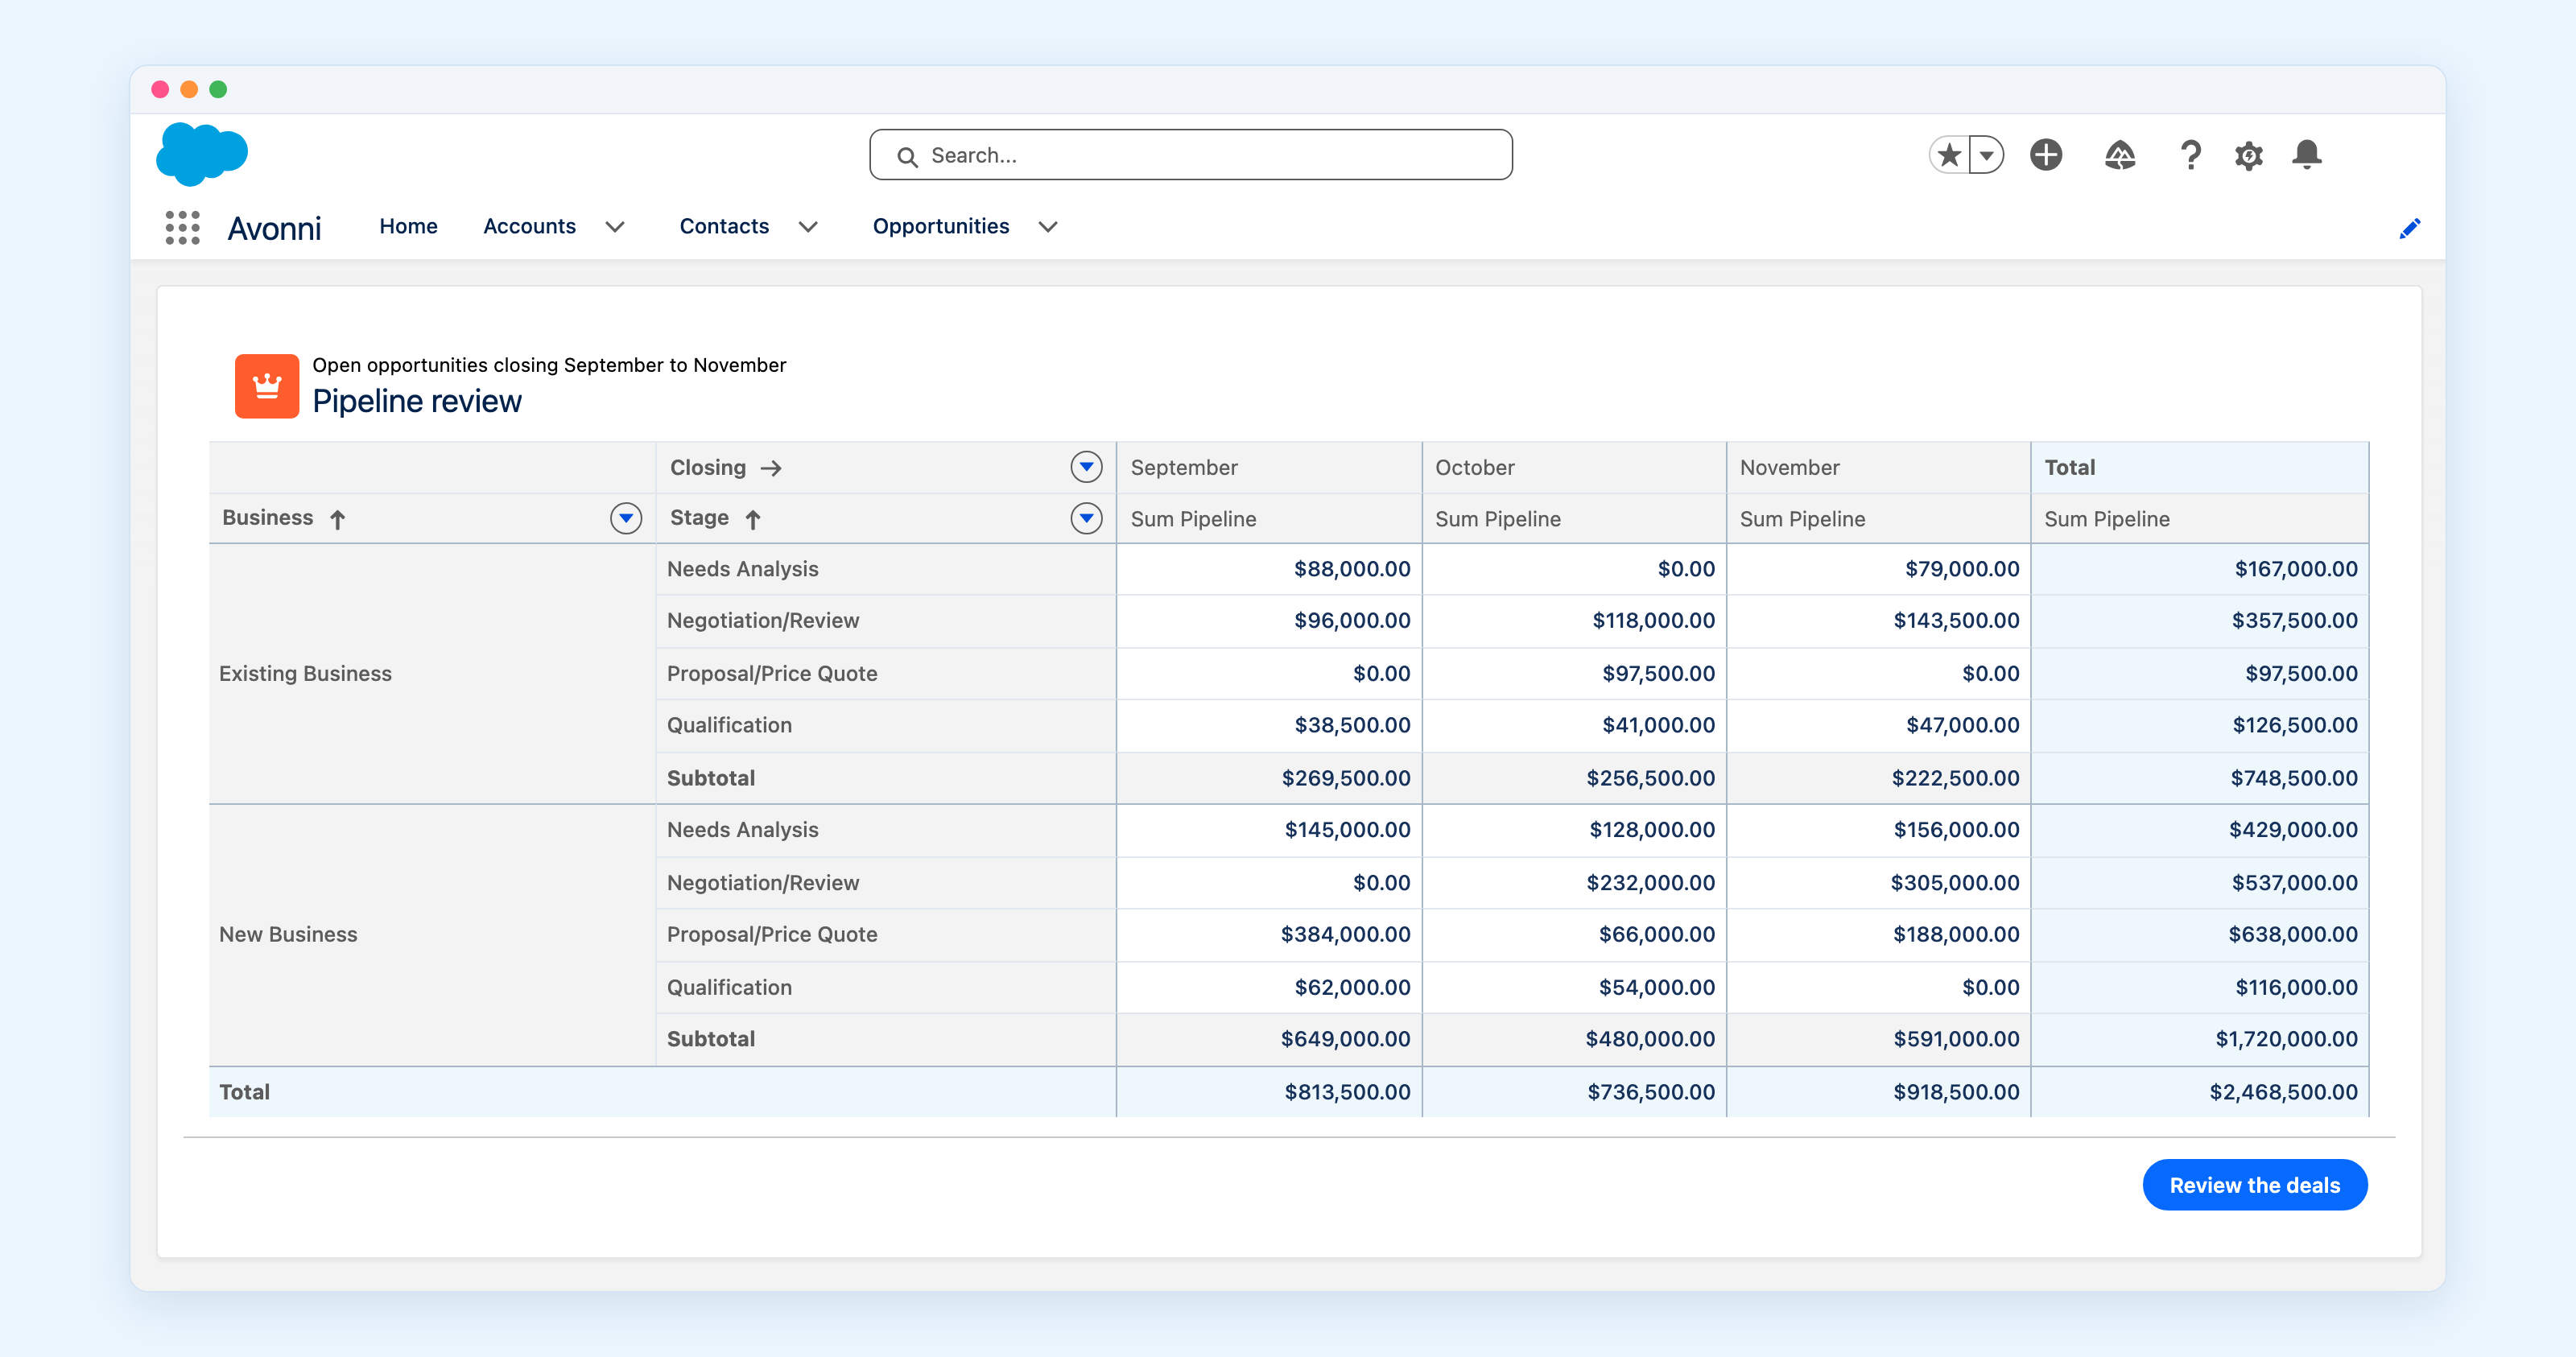
Here is what it looks like once it is there.
A subtotal under each business block, a grand total under everything, and the footer button that says this is a flow and not a page.
Twenty open opportunities, crossed two ways and totalled three ways, on a flow screen with a Next button. The flow behind it has no Get Records element, no loop and no Apex.
It is one of the Flow Screen Components, so it goes onto a screen the same way a Display Text does. It installs as a managed package, it needs no code, and the whole configuration below is a handful of settings in a property editor.
What the hand-built version costs
Say you build it by hand anyway. A Get Records brings the collection back, a loop walks it, and every total you want needs its own number variable and its own Assignment inside that loop. It works, and it has to be reopened and reasoned through again the day somebody asks for the split by month as well as by stage.
A loop also only counts along one axis at a time. Crossing two is where it stops paying for itself: the grid above is eight rows across three months, so twenty-four numbers, and that is before the subtotals and the grand total.
The Pivot Table does not make the flow better at aggregating. It runs the aggregate query itself, on the screen, and renders what comes back.
1. Drop it on the screen and pick the object
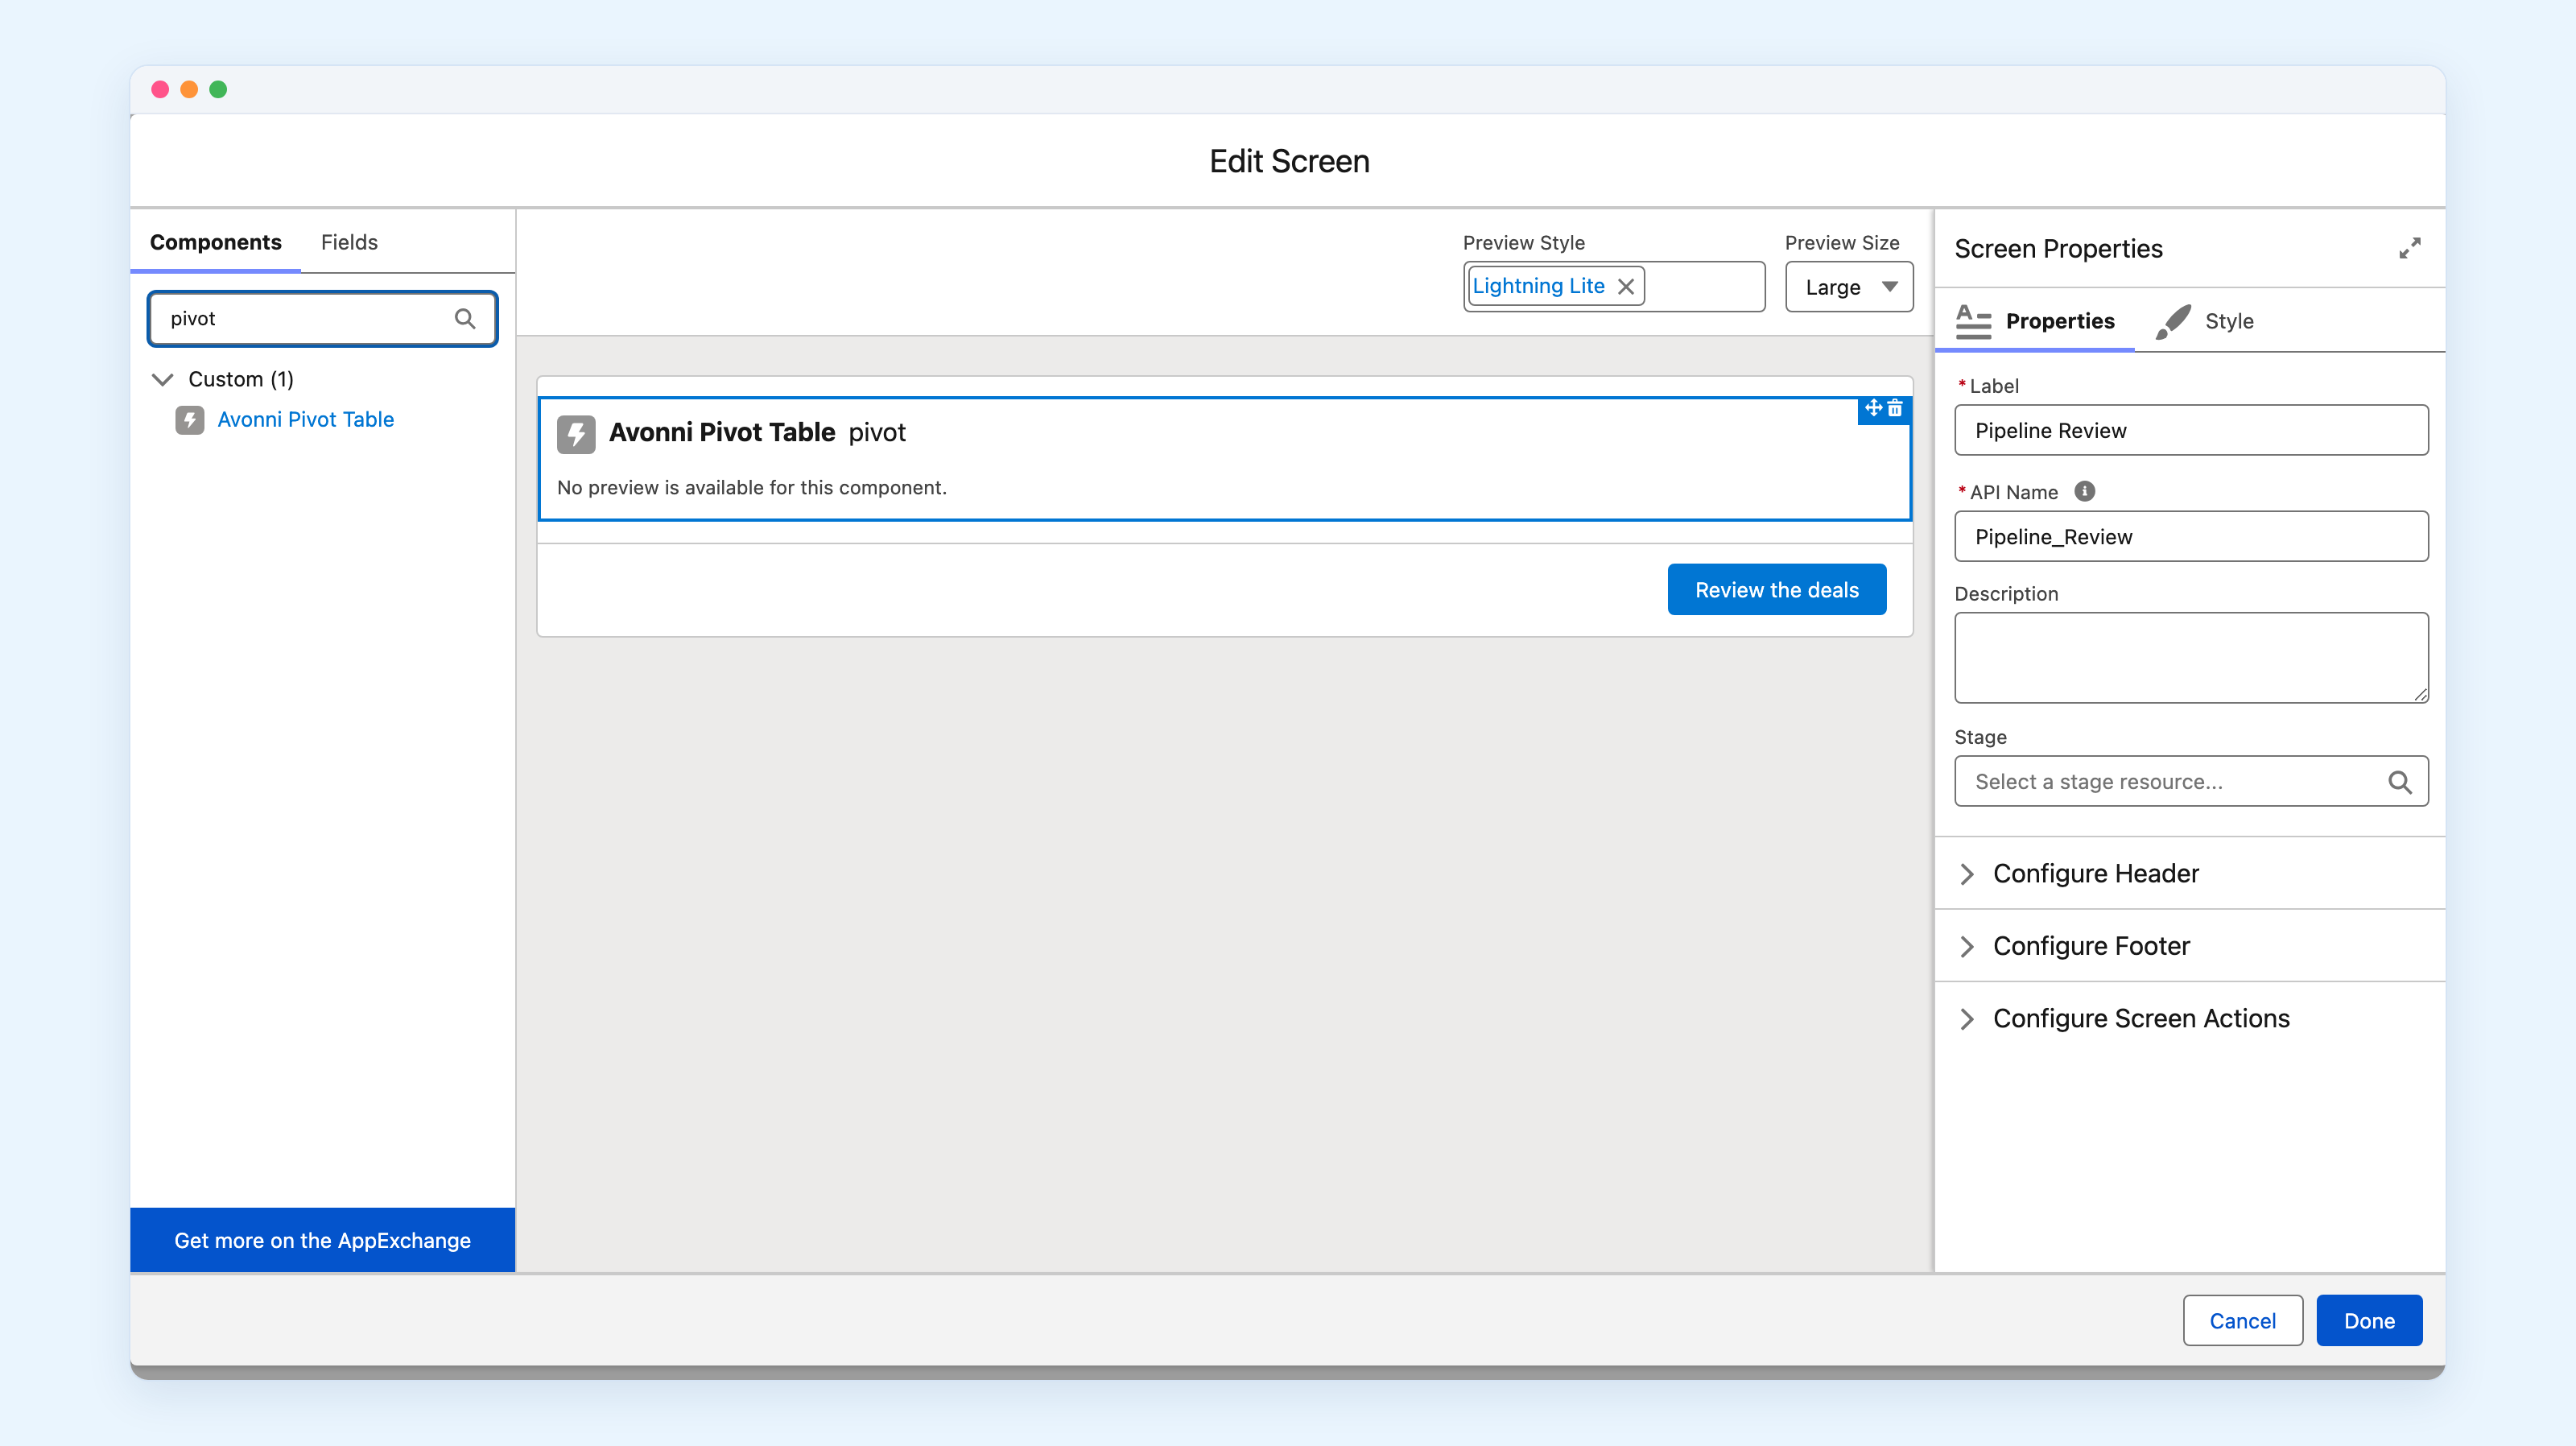
Open your screen in Flow Builder and search the component palette for the pivot table. It sits under Custom rather than with the standard screen components, because it arrives with the package.
The palette lists it under Custom. On the screen it says no preview is available, and it keeps saying that until the flow runs.
Drag it onto the screen and it lands as an empty block that says no preview is available. That is normal and it stays that way for the whole build: this component draws nothing until the flow actually runs and its query returns. You are configuring it blind, which is worth knowing before it worries you.
In its property editor, set the object the review is about. Ours is Opportunity.
Then scope it. The Pivot Table takes its records from a query it runs itself, and that is the part to know before you design the screen around it: query is the only data source it offers. The Data Table will happily take a collection you already have in the flow. The Pivot Table will not. A collection sitting in a flow variable cannot be pivoted.
That reads like a limitation and mostly is not. An aggregate belongs in the database rather than in the browser: the query comes back with twelve grouped rows instead of twenty records, and it would come back with twelve if there were twenty thousand. What it does mean is that a pivot cannot summarise something the flow assembled in memory a moment earlier. If that is your case, this is the wrong component.
Build the filter in the query editor rather than pasting in an expression, and keep it narrow. This component is about to show somebody a total, and they will read it as the whole picture.
2. Say what runs down the side and what runs across the top
Everything that makes it a pivot lives in one section of the property editor, Data Mappings, and it has three parts.
Two Group Rows, one Group Column, one aggregation. Everything that makes it a pivot sits in this one panel.
Group Rows are the fields listed down the left. Add one and you get a row per value. Add a second and the first nests the second, which is what produces the two blocks in the finished screen: business type on the outside, stage within it.
Group Columns are the fields spread across the top. Same idea, turned ninety degrees.
Aggregations are the numbers in the middle. Pick a field, then pick what to do with it: Sum, Average, Count, Count Distinct, Maximum or Minimum.
Three lists, and that is the whole configuration. It is also why changing the question from "by stage" to "by stage and by owner" is one entry rather than a rebuild.
The date field earns you something else for free. A date or datetime chosen as a grouping gets a Date Grouping setting that buckets by year, quarter, month, week, day, or the combinations year-month, year-quarter and year-week. That is where September, October and November come from. There is no formula field behind them and no month field on the record. Turn on Display Full Label and you get the month name instead of the number 9.
3. Turn on the parts that make it readable
Back in the Properties tab, four switches decide what the screen is worth.
Grand total and subtotals on, stacked summaries off, and the two Detail Rows switches that decide whether the numbers can be opened.
Show Grand Total adds the total row and the total column. Show Subtotals adds a subtotal per group, and it needs more than one field on an axis to have anything to total: with a single Group Row there is no group to sum, so the switch does nothing you can see. That is the second reason to nest business type above stage rather than settling for one grouping.
Then there is Detail Rows, which is the switch that changes what the screen is for. With it on, every number becomes clickable.
4. Let them open a number
Nobody stops at the total. They want to know which deals are inside it.
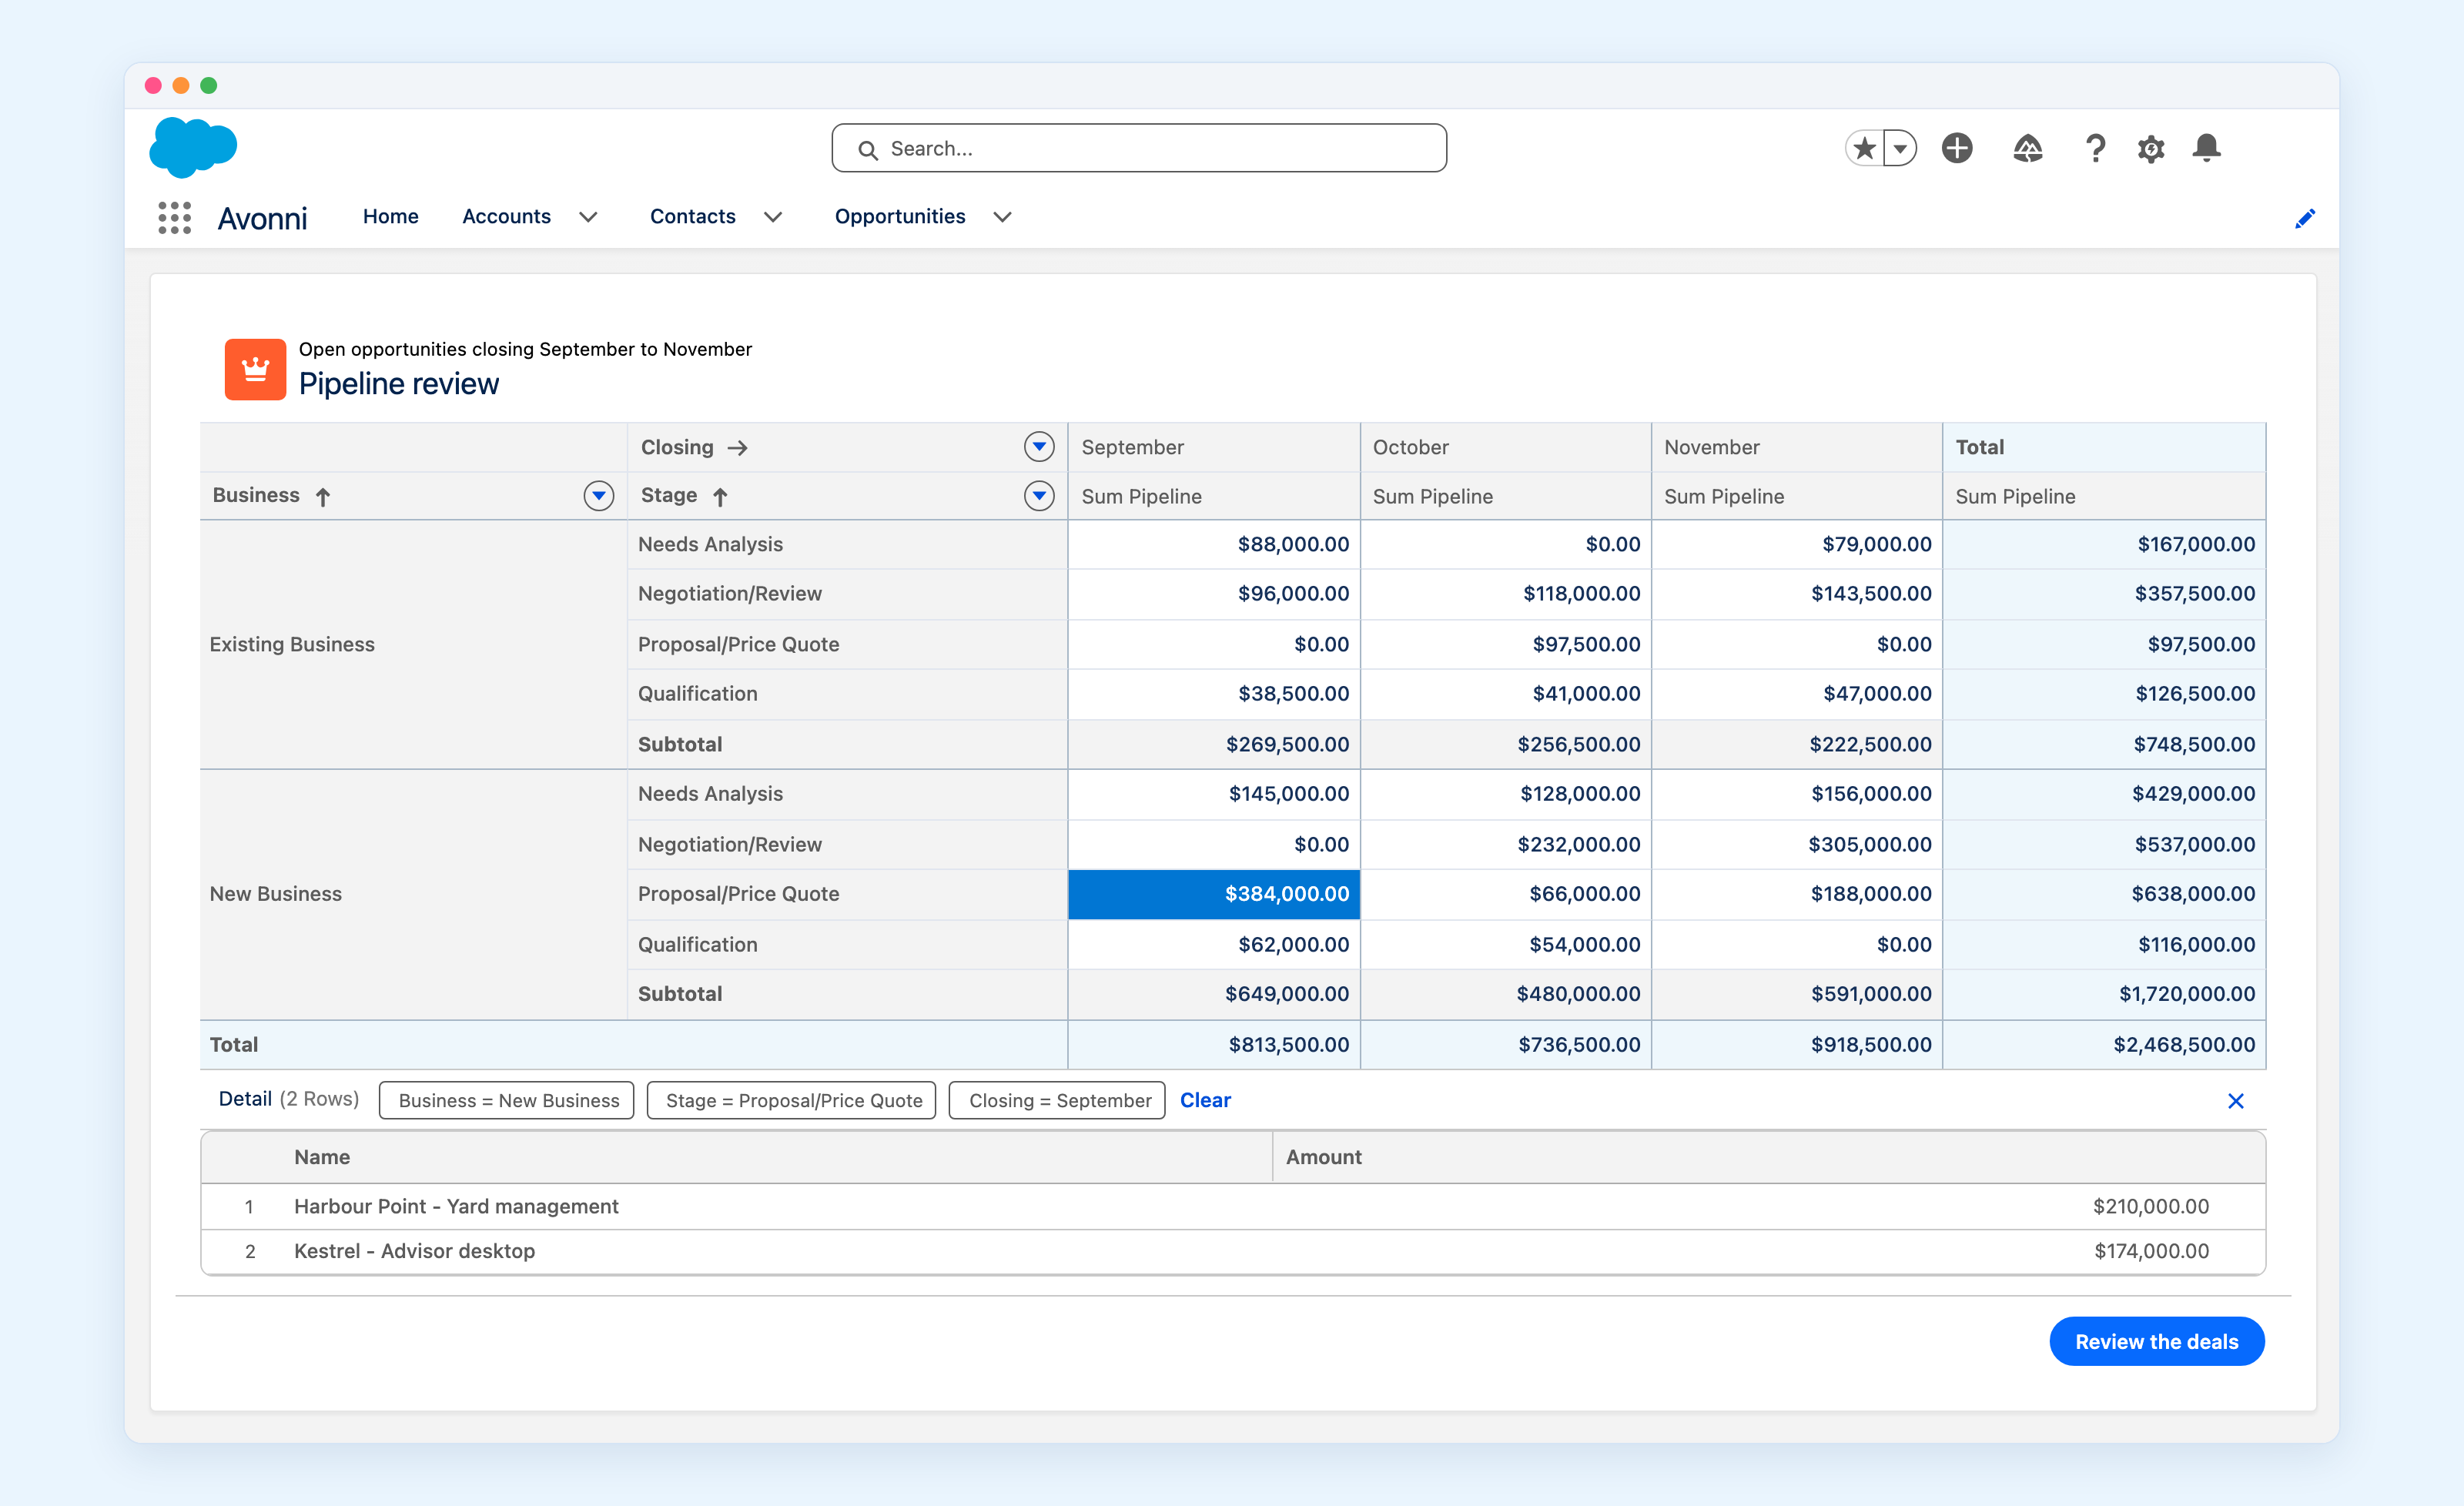
The badges name the cell that was clicked. The two deals under them add up to the number above.
Click $384,000 and the two deals inside it open underneath, with the group they came from spelled out as badges so nobody has to remember which cell they pressed. The detail view stays narrow on purpose: you get the record name and a column for each field you aggregated, and that is all. It shows you the number opened up rather than a second version of the record page.
Turn on Enable Inline Edit beside Detail Rows and those amounts become editable there. The reviewer spots the deal that has obviously slipped, corrects it on the spot, and carries on to the next screen. That is the case for putting the summary inside the flow instead of sending someone to a report. In a report they look, and then they go somewhere else to act.
5. Give the screen a footer
A flow screen with its footer switched off is indistinguishable from a Lightning page, and a reviewer needs somewhere to go next anyway. Leave the footer on and give the button a real label. Ours says Review the deals.
But wouldn't a Data Table have done this?
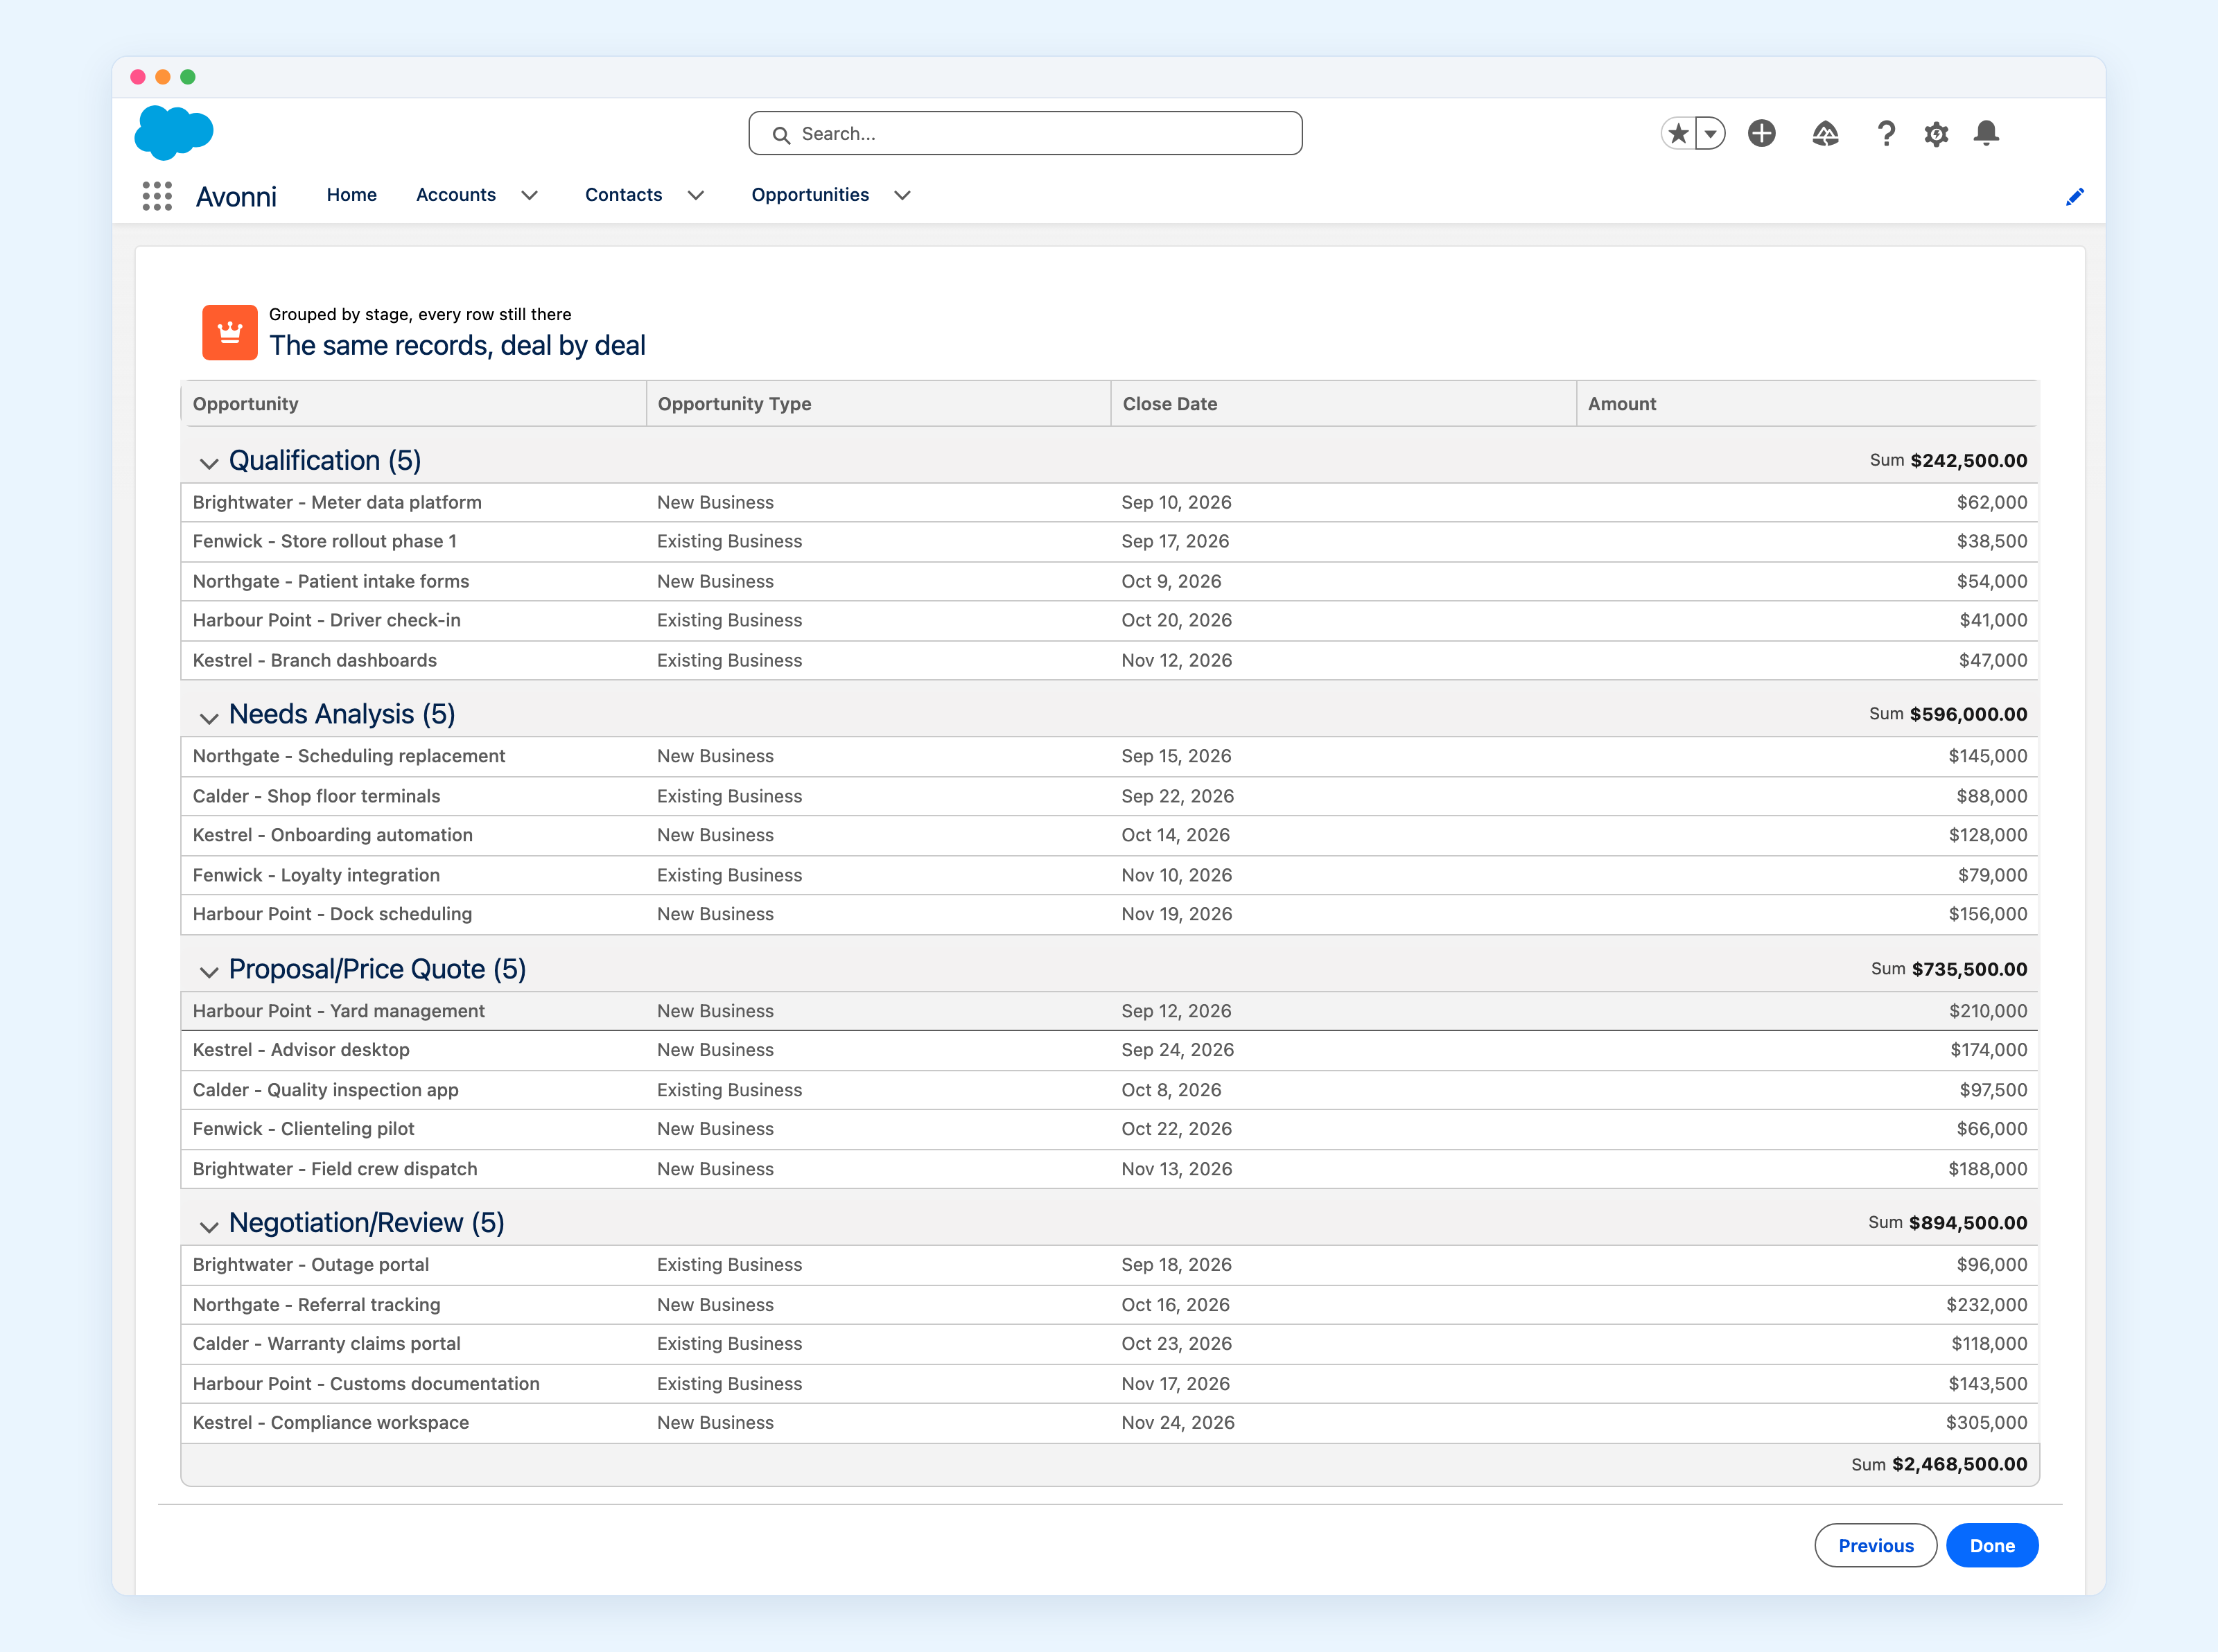
Often, yes, and it is fair to ask. The Avonni Data Table groups too, and it sums each group and gives you a grand total. Here is the same query and the same twenty records, on the next screen of the same flow:
The same twenty records, grouped by stage with a sum per group. Every row is still there, which is the whole difference.
Look at what each one gives up.
The Data Table groups on one axis and keeps every row. You can see Brightwater sitting in Qualification at $62,000, and because the row survives, everything you normally do to a row is still available to you. What you cannot see is how any of it splits by month, unless you group on month instead and lose the stage view.
The Pivot Table crosses two axes and keeps no rows at all. It answers how much, by what, against what, before anyone scrolls, and hands the rows back only when somebody asks for them.
So if the person on the screen has to act on individual records, use the Data Table. If they have to understand a shape before they act, use the Pivot Table. On a review screen that usually means the pivot first and the table second, which is exactly the two-screen flow above.
What the flow actually looks like
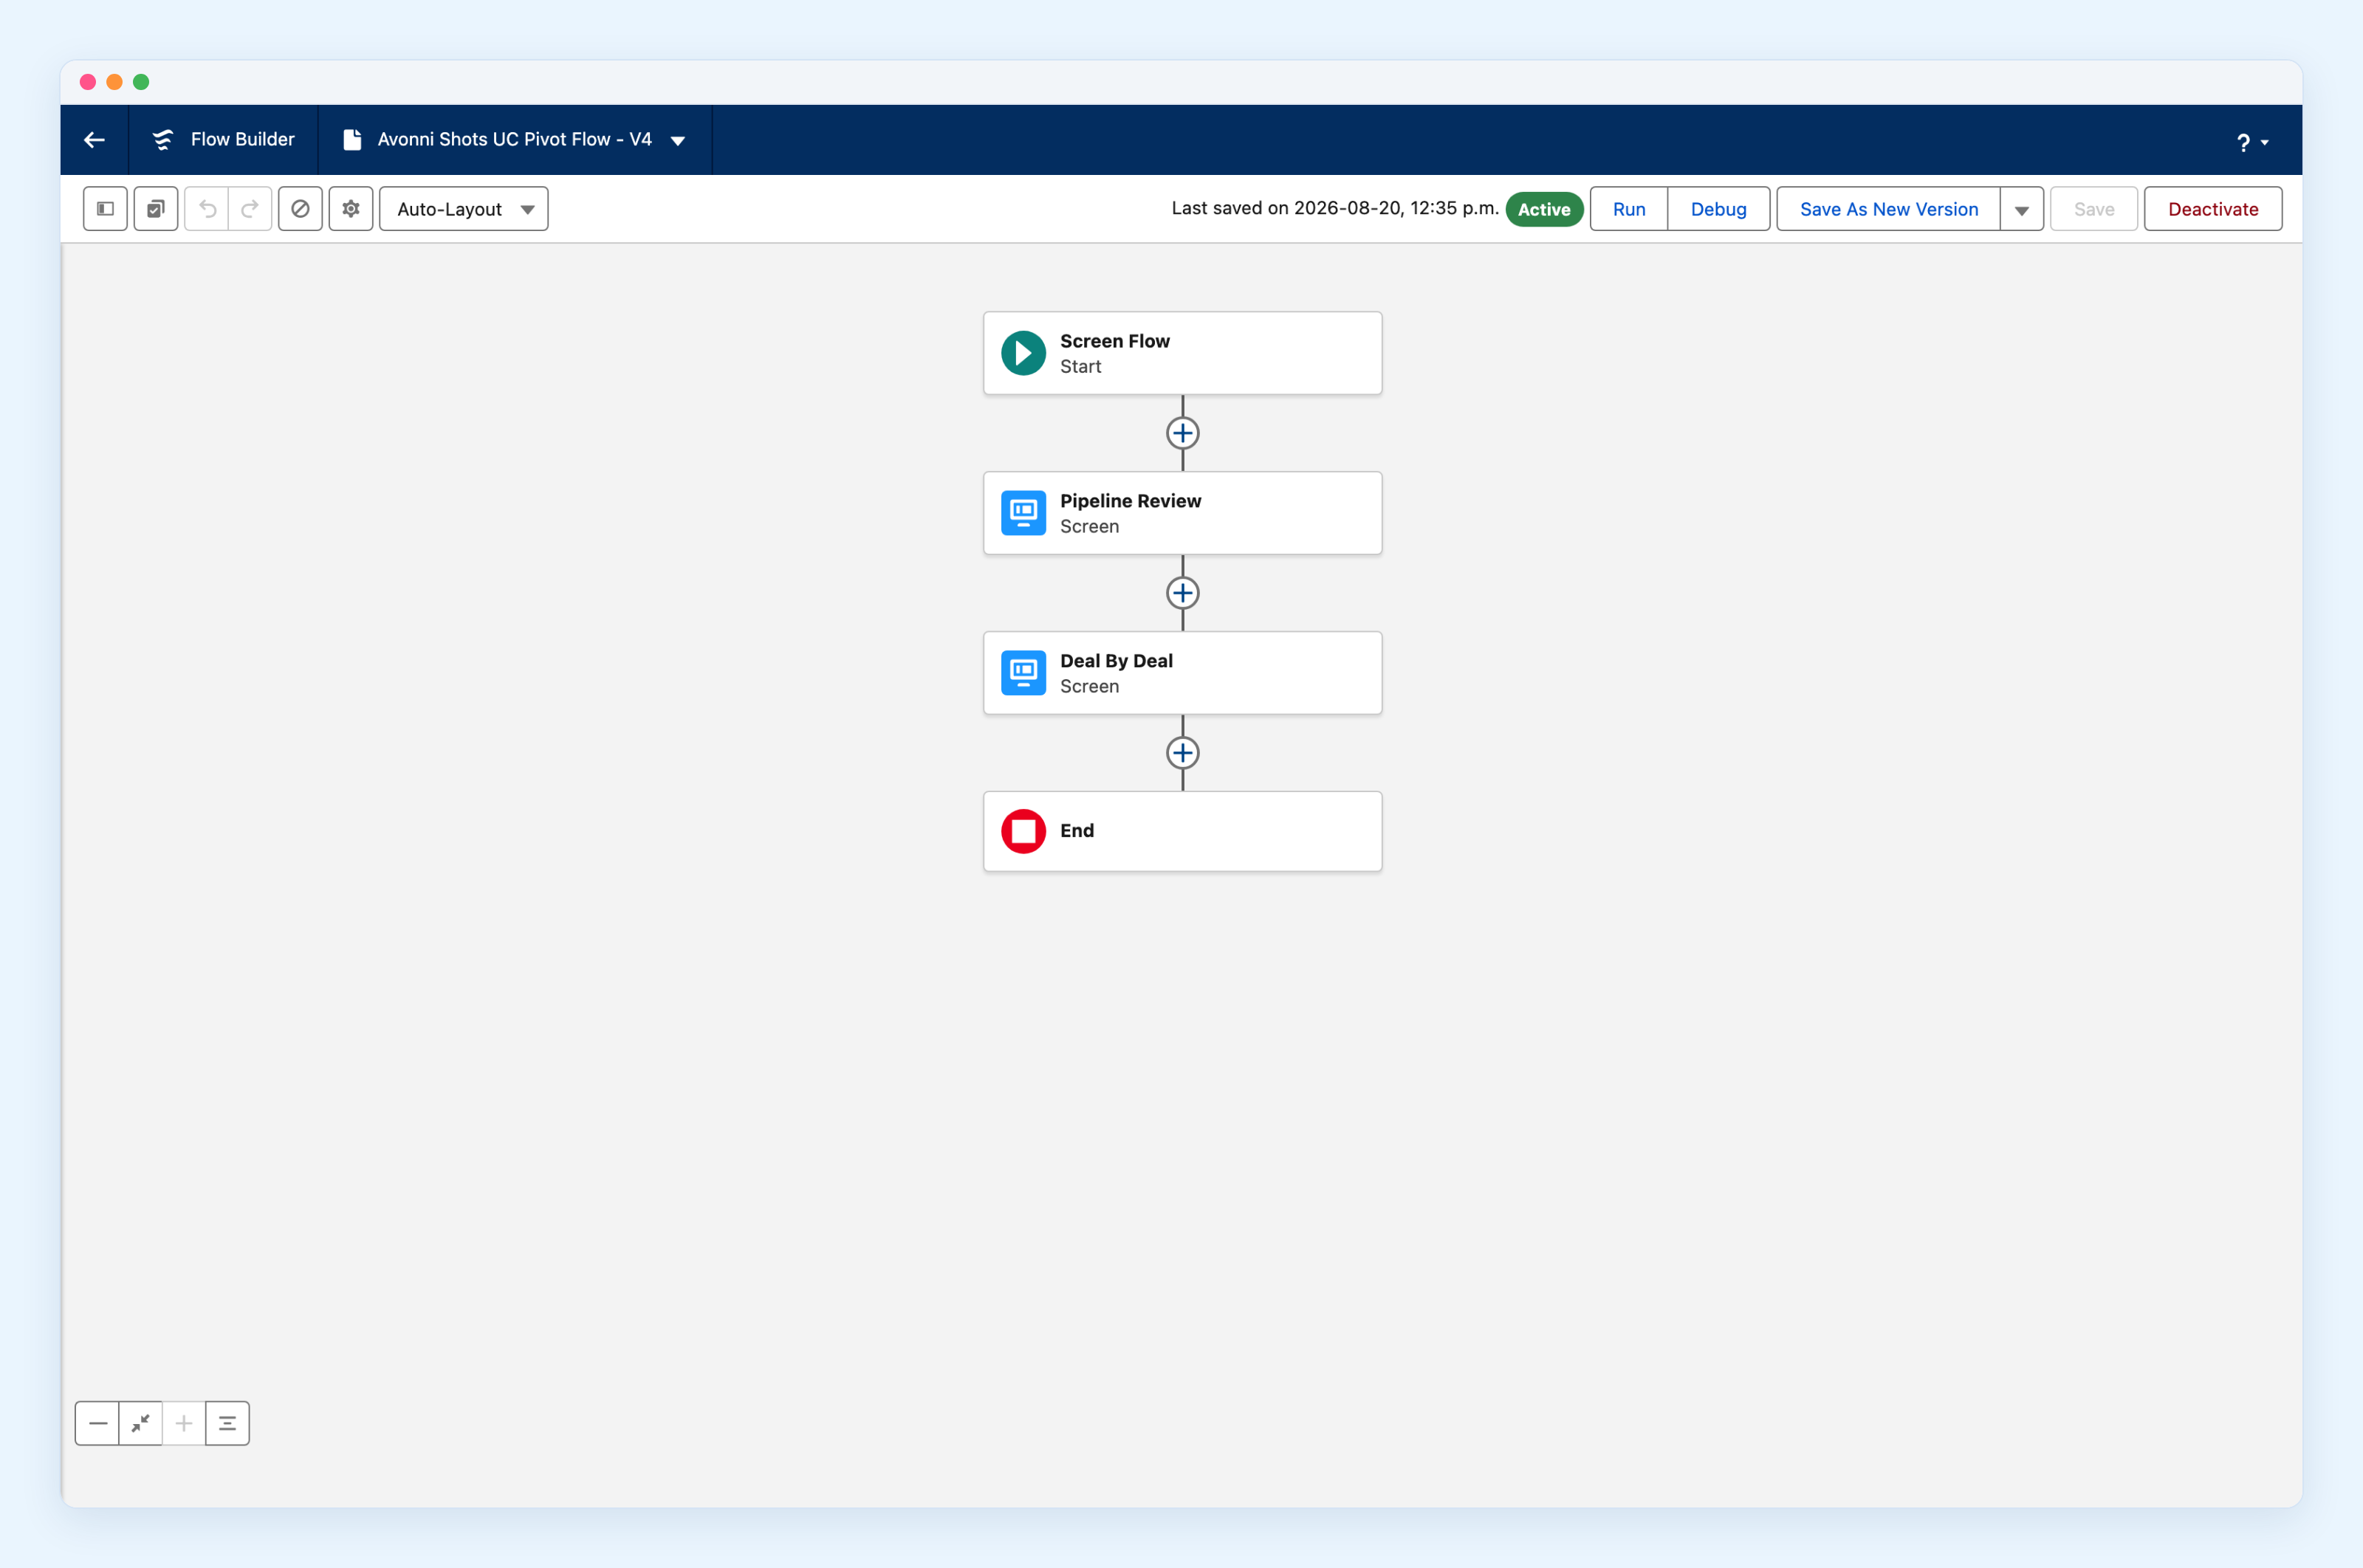
Two screens and nothing between them. No Get Records, no loop, no Assignment.
Two screens, and between them nothing at all: no Get Records, no loop, no Assignment, no Apex action. Each component runs its own query when its screen renders, which is why the canvas stays this short, and why adding a third grouping tomorrow will not add an element to it.
If you see this
"field 'X__c' can not be grouped in a query call". You picked a formula field as a Group Row or Group Column. That message comes from Salesforce rather than from the component: a formula is calculated when the record is read and has no stored column, so the database refuses to group on it. No setting fixes it. Group on a field that is actually stored, and for the common case of wanting a lookup's name rather than its Id, group on the lookup itself or on a text field an automation keeps up to date.
Cells showing $0.00 where you expected blanks. An empty intersection is a real zero for a Sum, and the component prints it rather than leaving a hole. Check the grand total against a report the first time you build one, so you know exactly what your filter is catching.
Where to start
Take the report your team opens every Monday and ask what decision it leads to. If the answer is a decision somebody makes in Salesforce, that report wants to be a flow, and its first screen wants to be a pivot: the numbers, the records behind them, and the action, without anybody changing tabs.
Two Group Rows, one Group Column, one aggregation, subtotals and grand total on. That is the entire configuration behind the first figure, and the Pivot Table documentation covers every property named here.
The Pivot Table arrived on flow screens in Flow Screen Components 6.30.0, released 10 July 2026. Built and photographed on 6.31.0 in a live Salesforce org. Every figure is a screenshot of the flow described above, running.








%20(Vignette%20YouTube)%20(81).png)