Two releases in five weeks, and a long list of things the Avonni Components can do now
Two releases, five weeks apart. The Tree Grid arrives in Flow and then in the Dynamic Component Builder, the Data Table totals itself, and a Pivot Table runs on a flow screen.
Two Avonni releases went out over the summer, five weeks apart: July 10 and August 12, across all four suites. Unless you went looking at the changelog, there is a fair chance you are running a version that already does something you are currently building around by hand.
So here is the recap of both, grouped by what changed rather than by version number. The install links and the per-item suite tags are in the changelog; this is the part that explains why any of it matters.
Put a hierarchy in a table and stop repeating the parent
Parent and child records have always been awkward in a flat table. You repeat the parent on every row, or you split the data across two tables and lose the relationship between them.
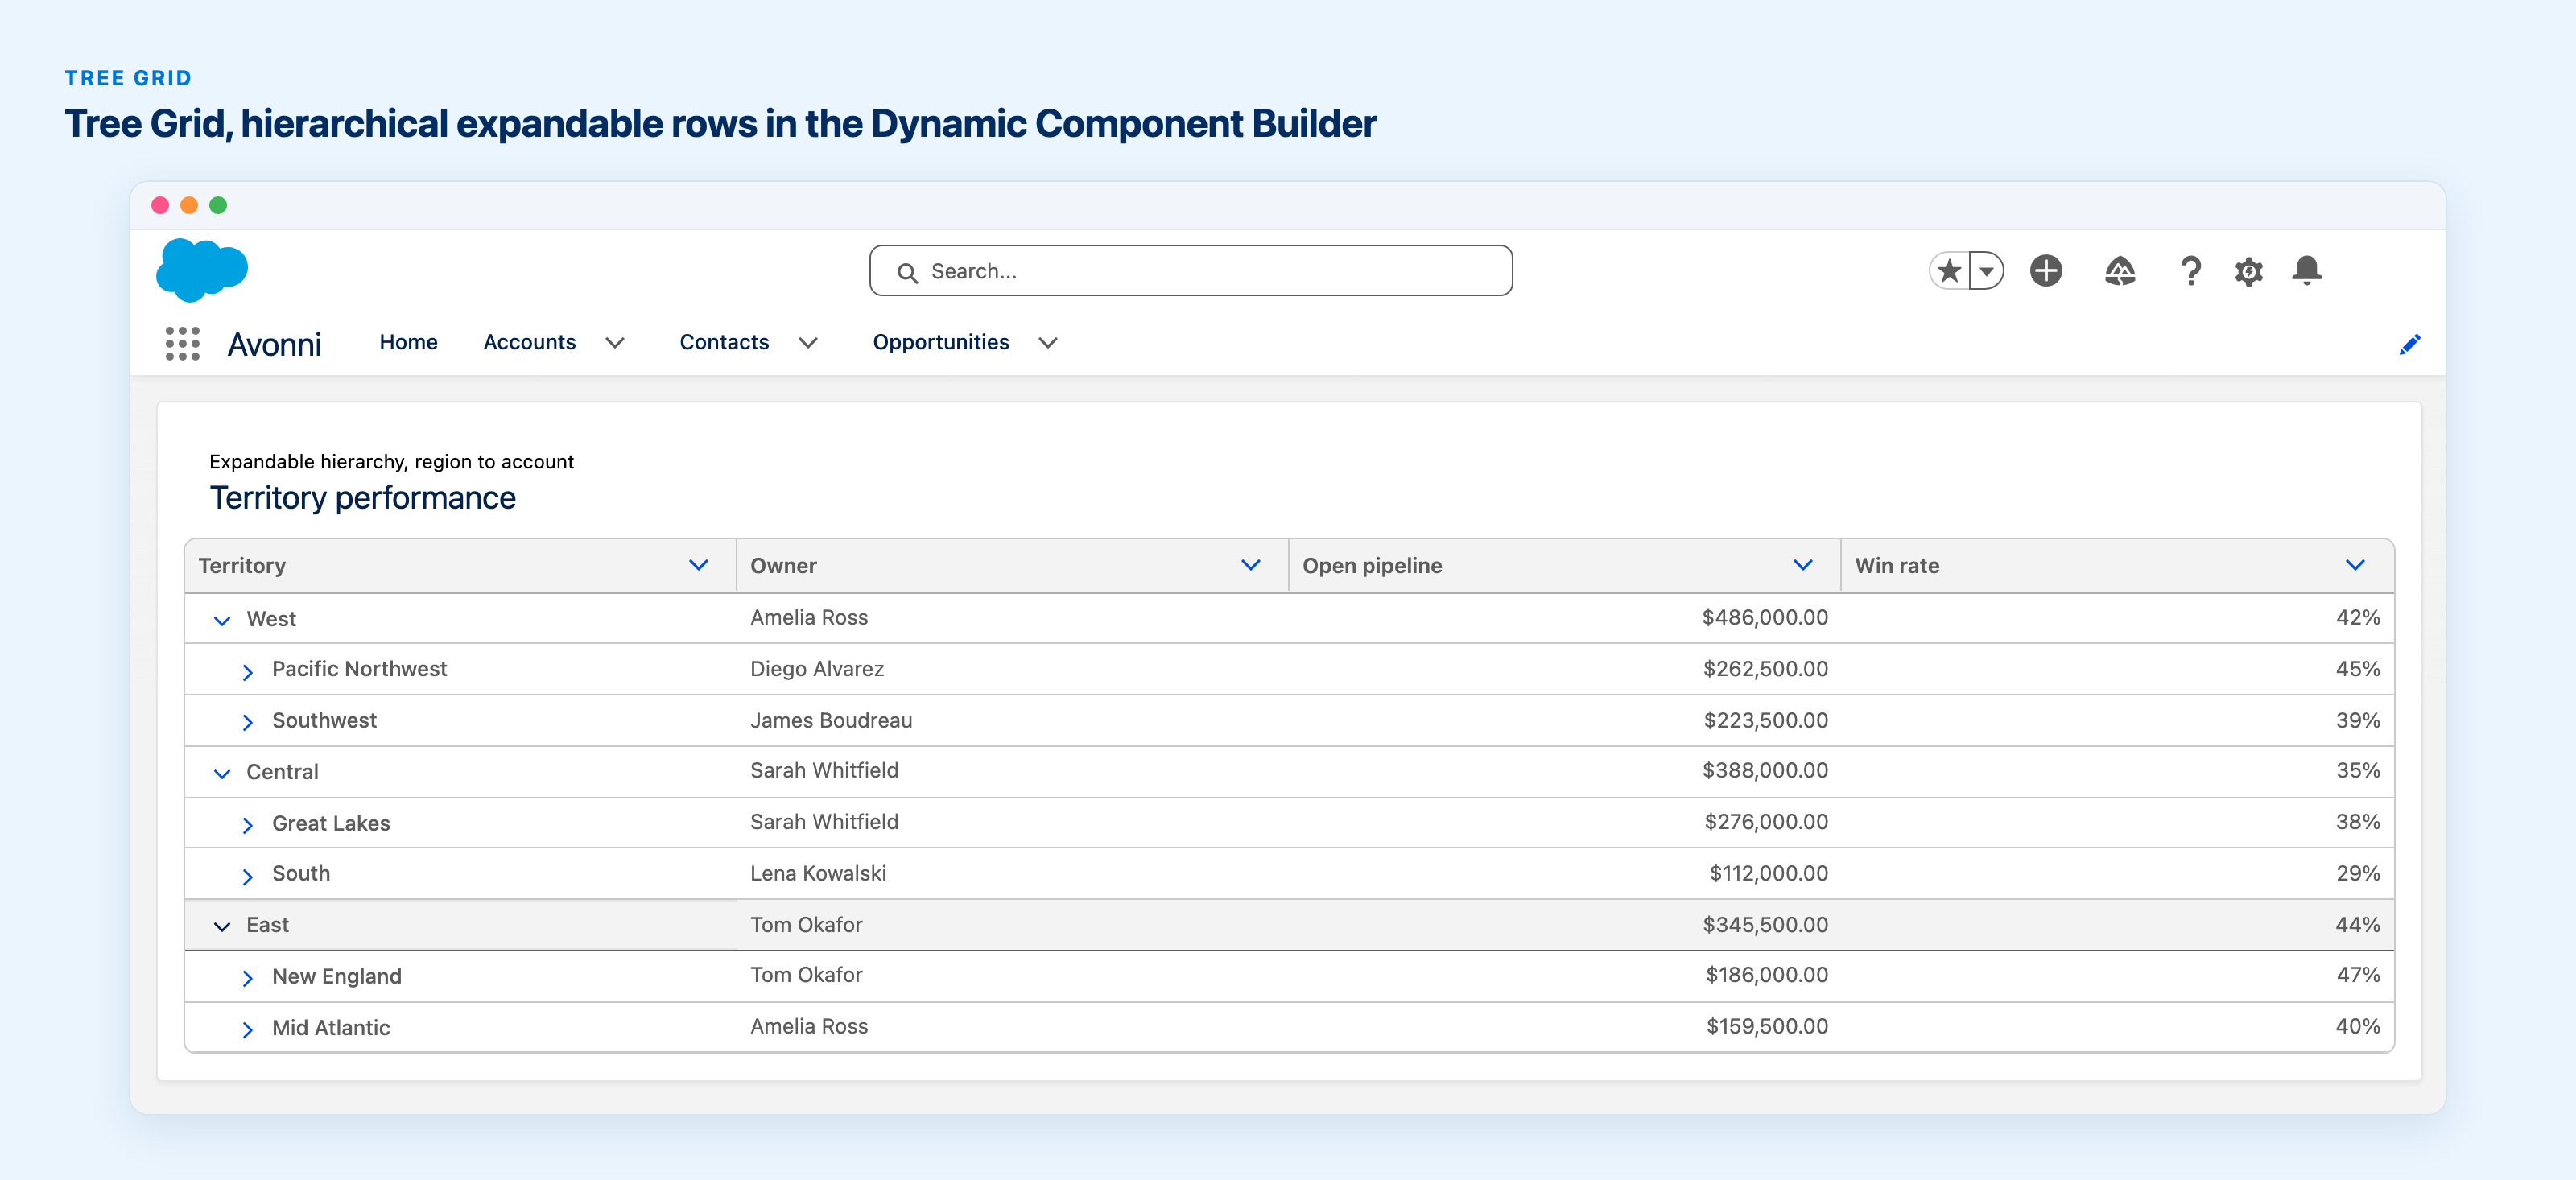
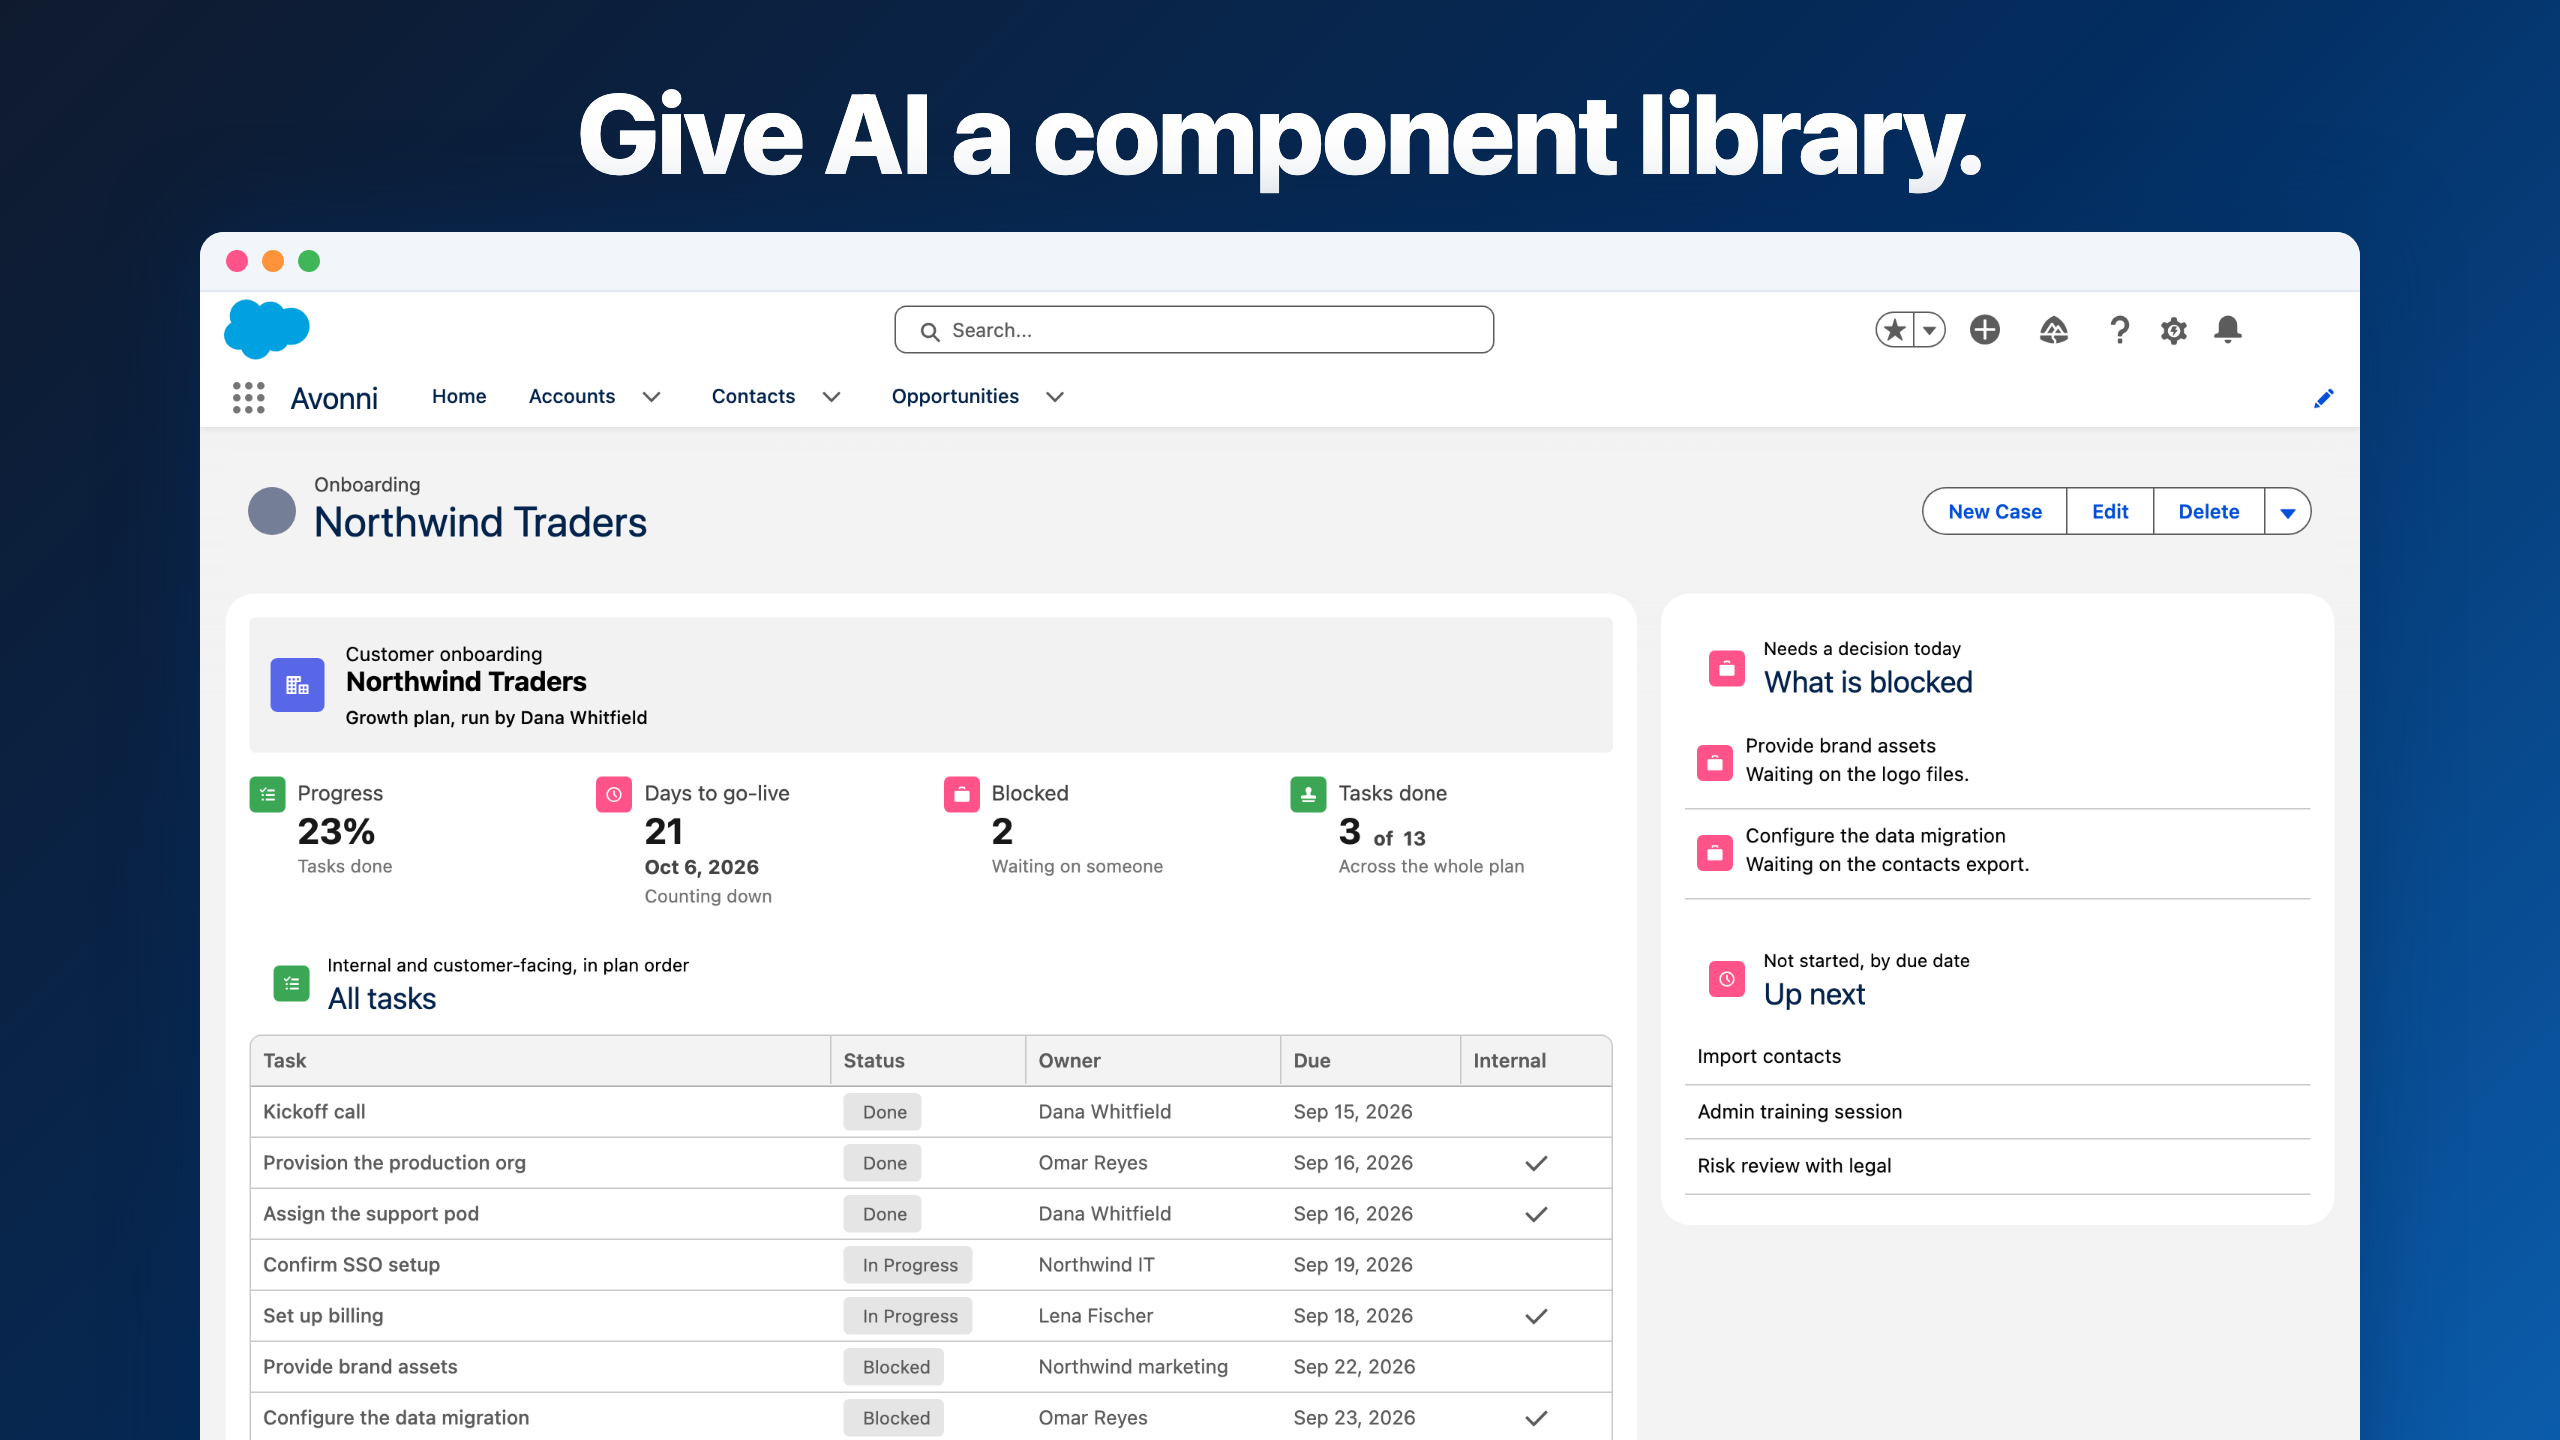
The Tree Grid closes that, over the two releases. In July it arrived for Flow Screen Components, building the hierarchy from a query. In August it reached the Dynamic Component Builder and Experience sites, with the full range of Data Table column types, static data or SOQL, sorting, row selection, and load more for the long ones.
A territory and the regions under it. An account and its child accounts. A product catalog and its categories. One grid, expandable in place.
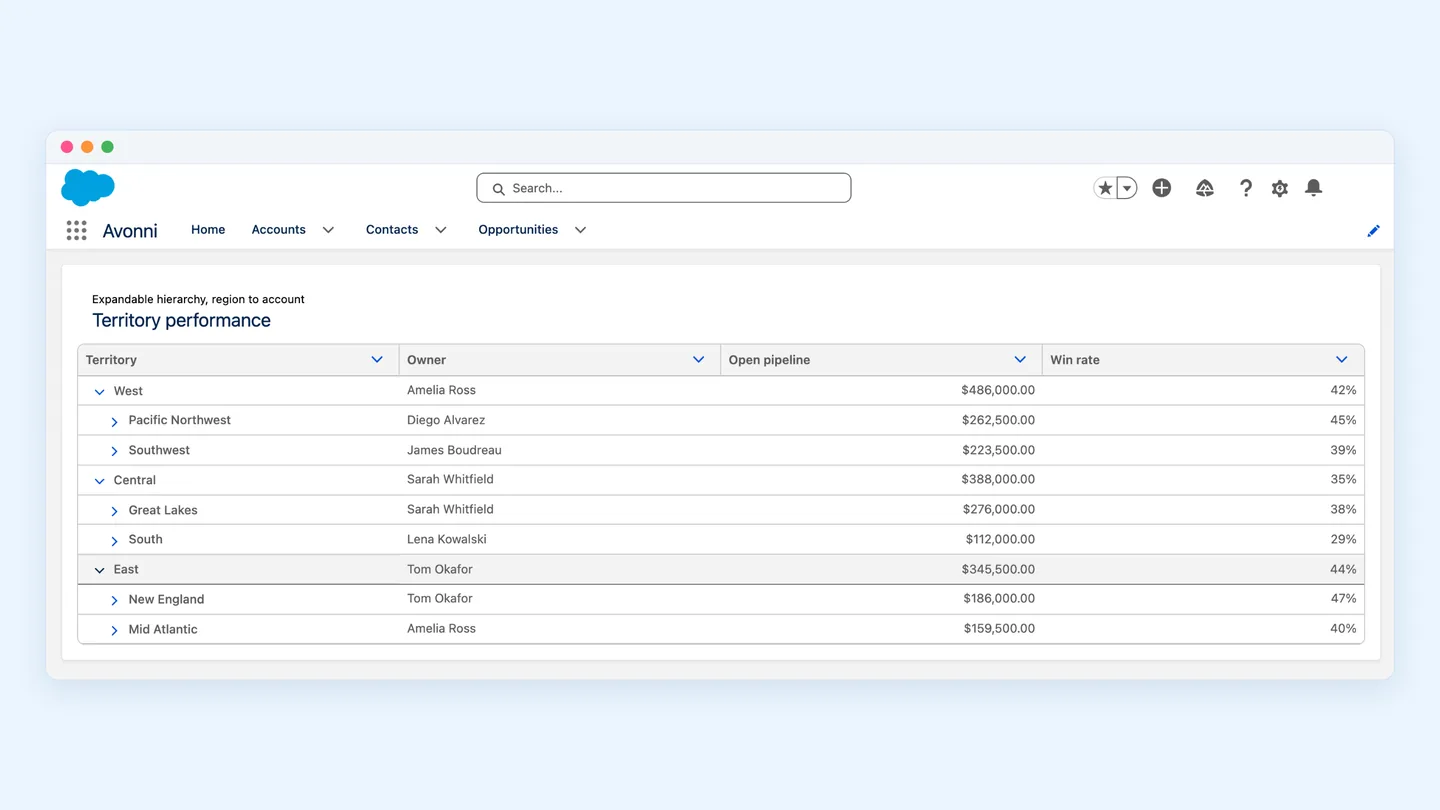
Three regions expanded one level, in the Dynamic Component Builder.
Total the table where people are already reading it
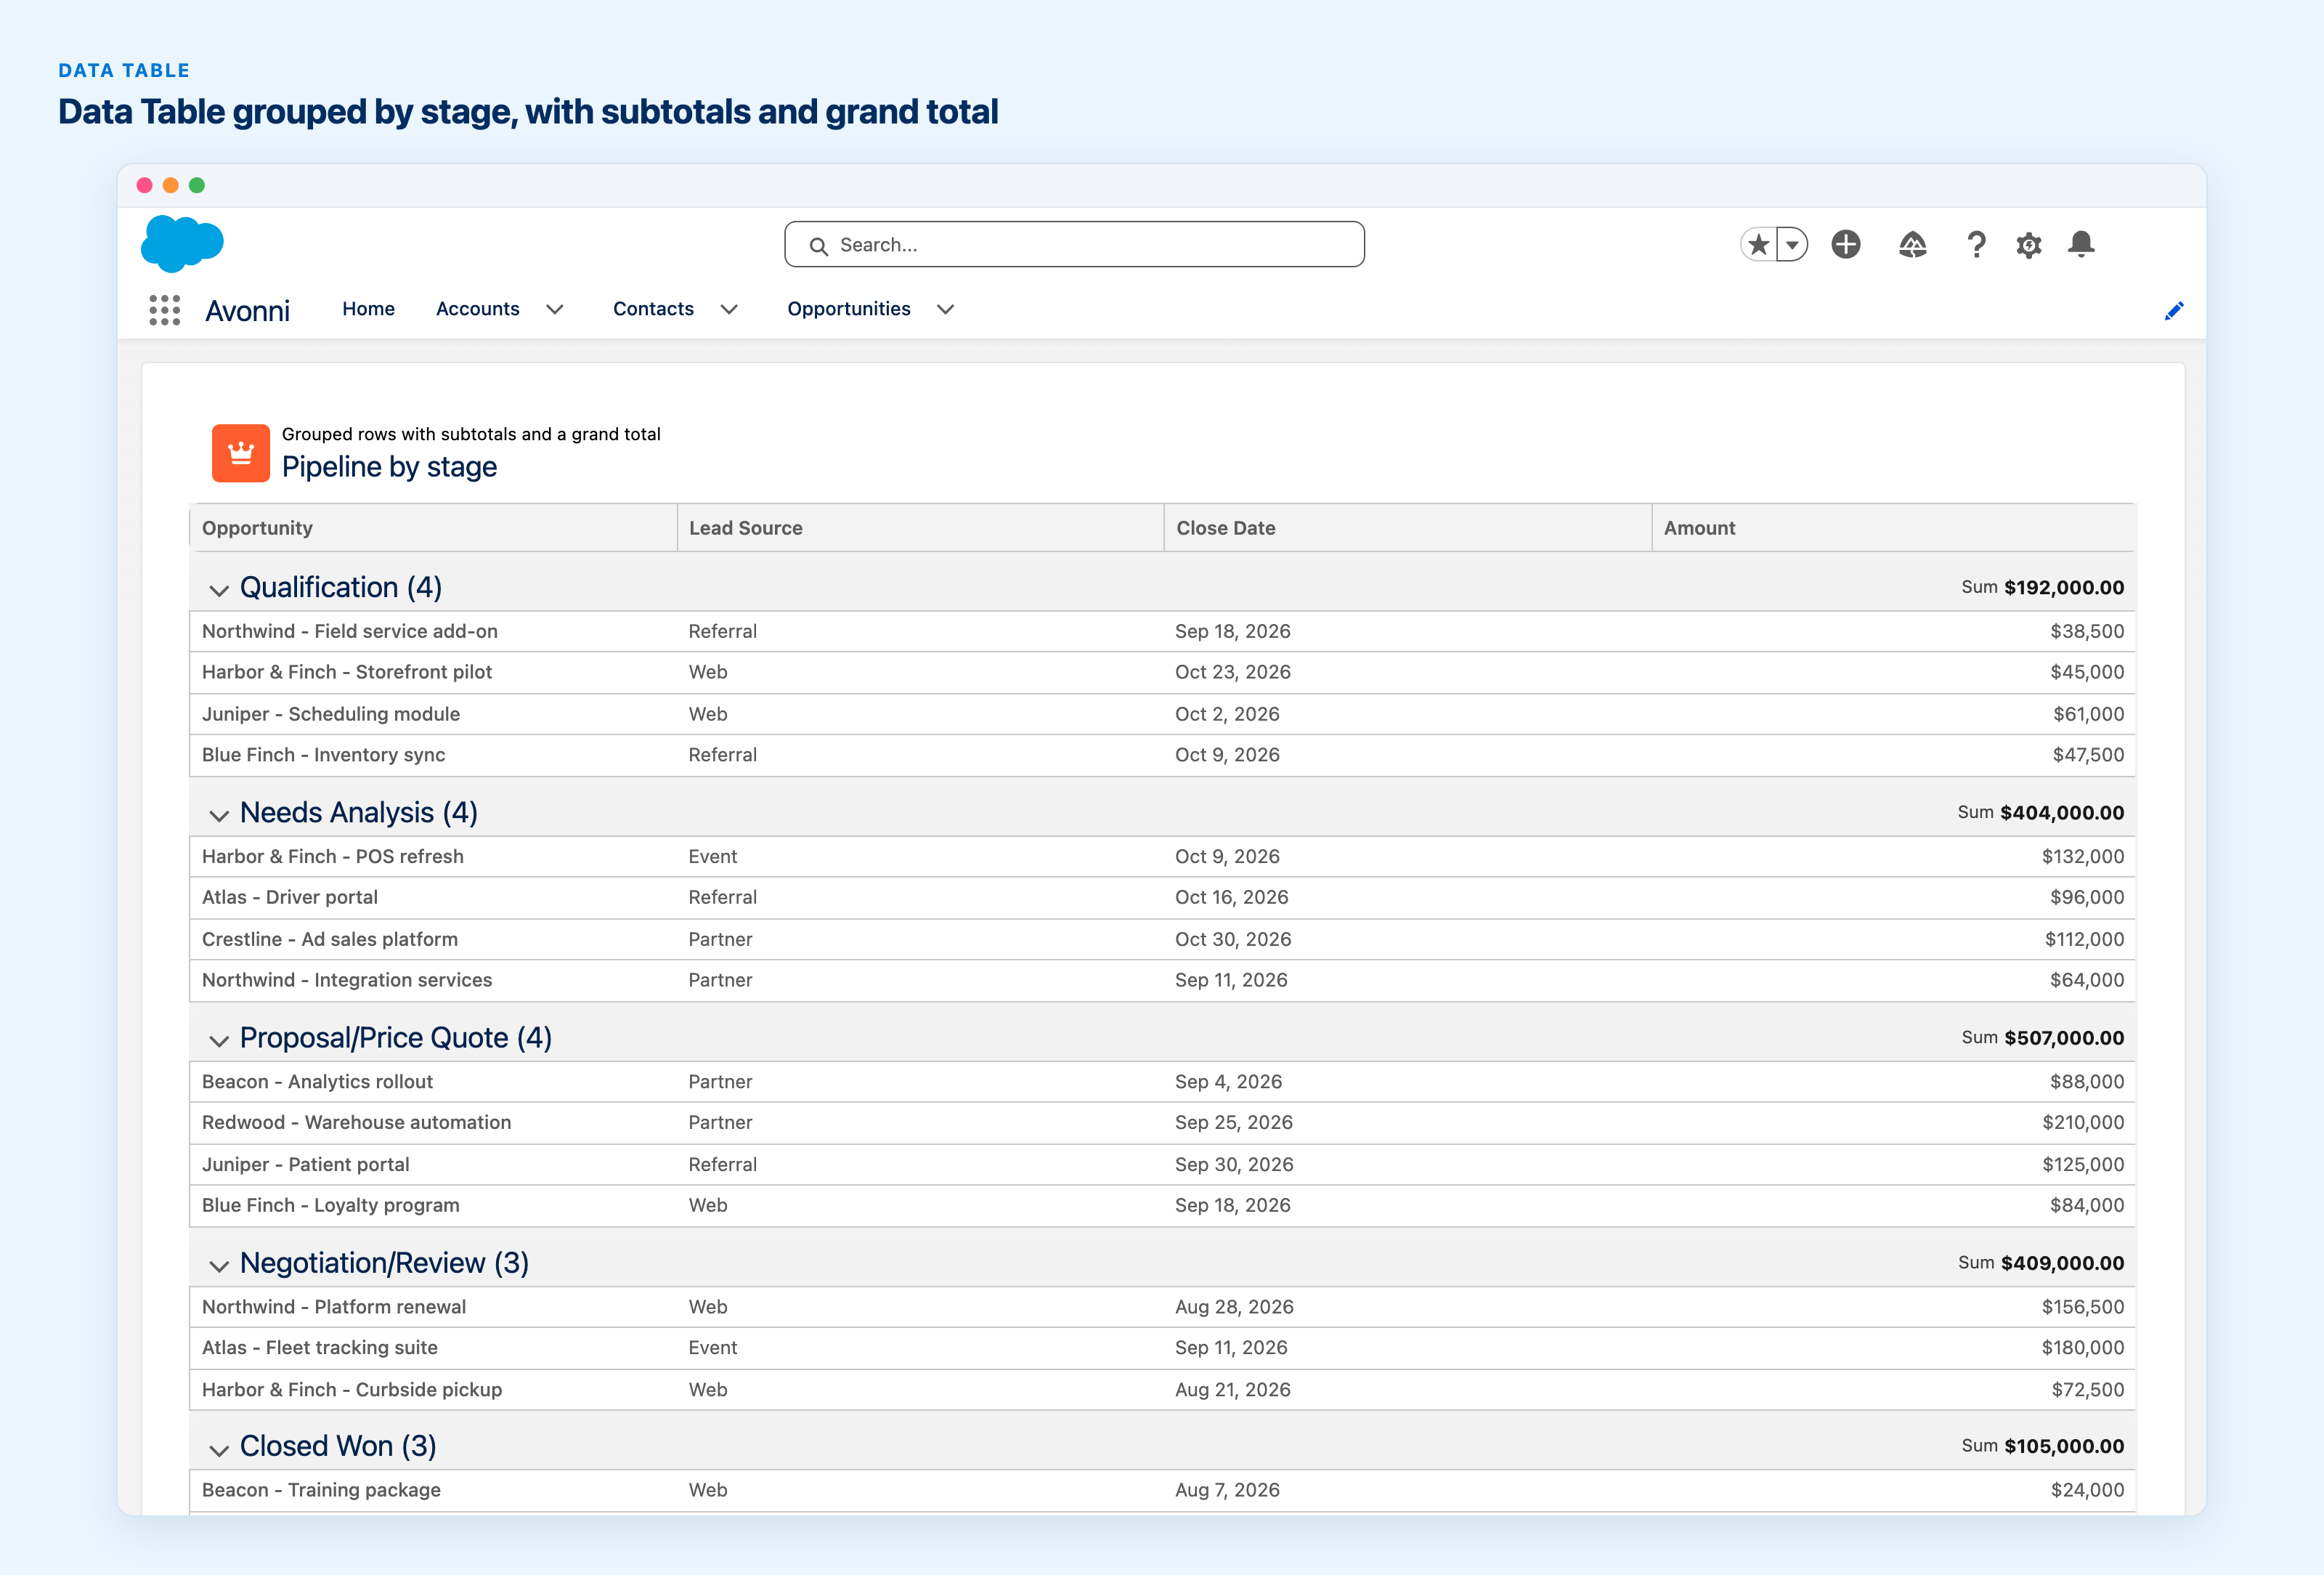
The July release gave the Data Table group aggregations. Group the rows by a field and each group carries its own subtotal, with a grand total at the bottom.
This is the thing people were doing in a spreadsheet. Export the list view, drop in a pivot, send the screenshot back. Now the number is on the page the rep already had open.
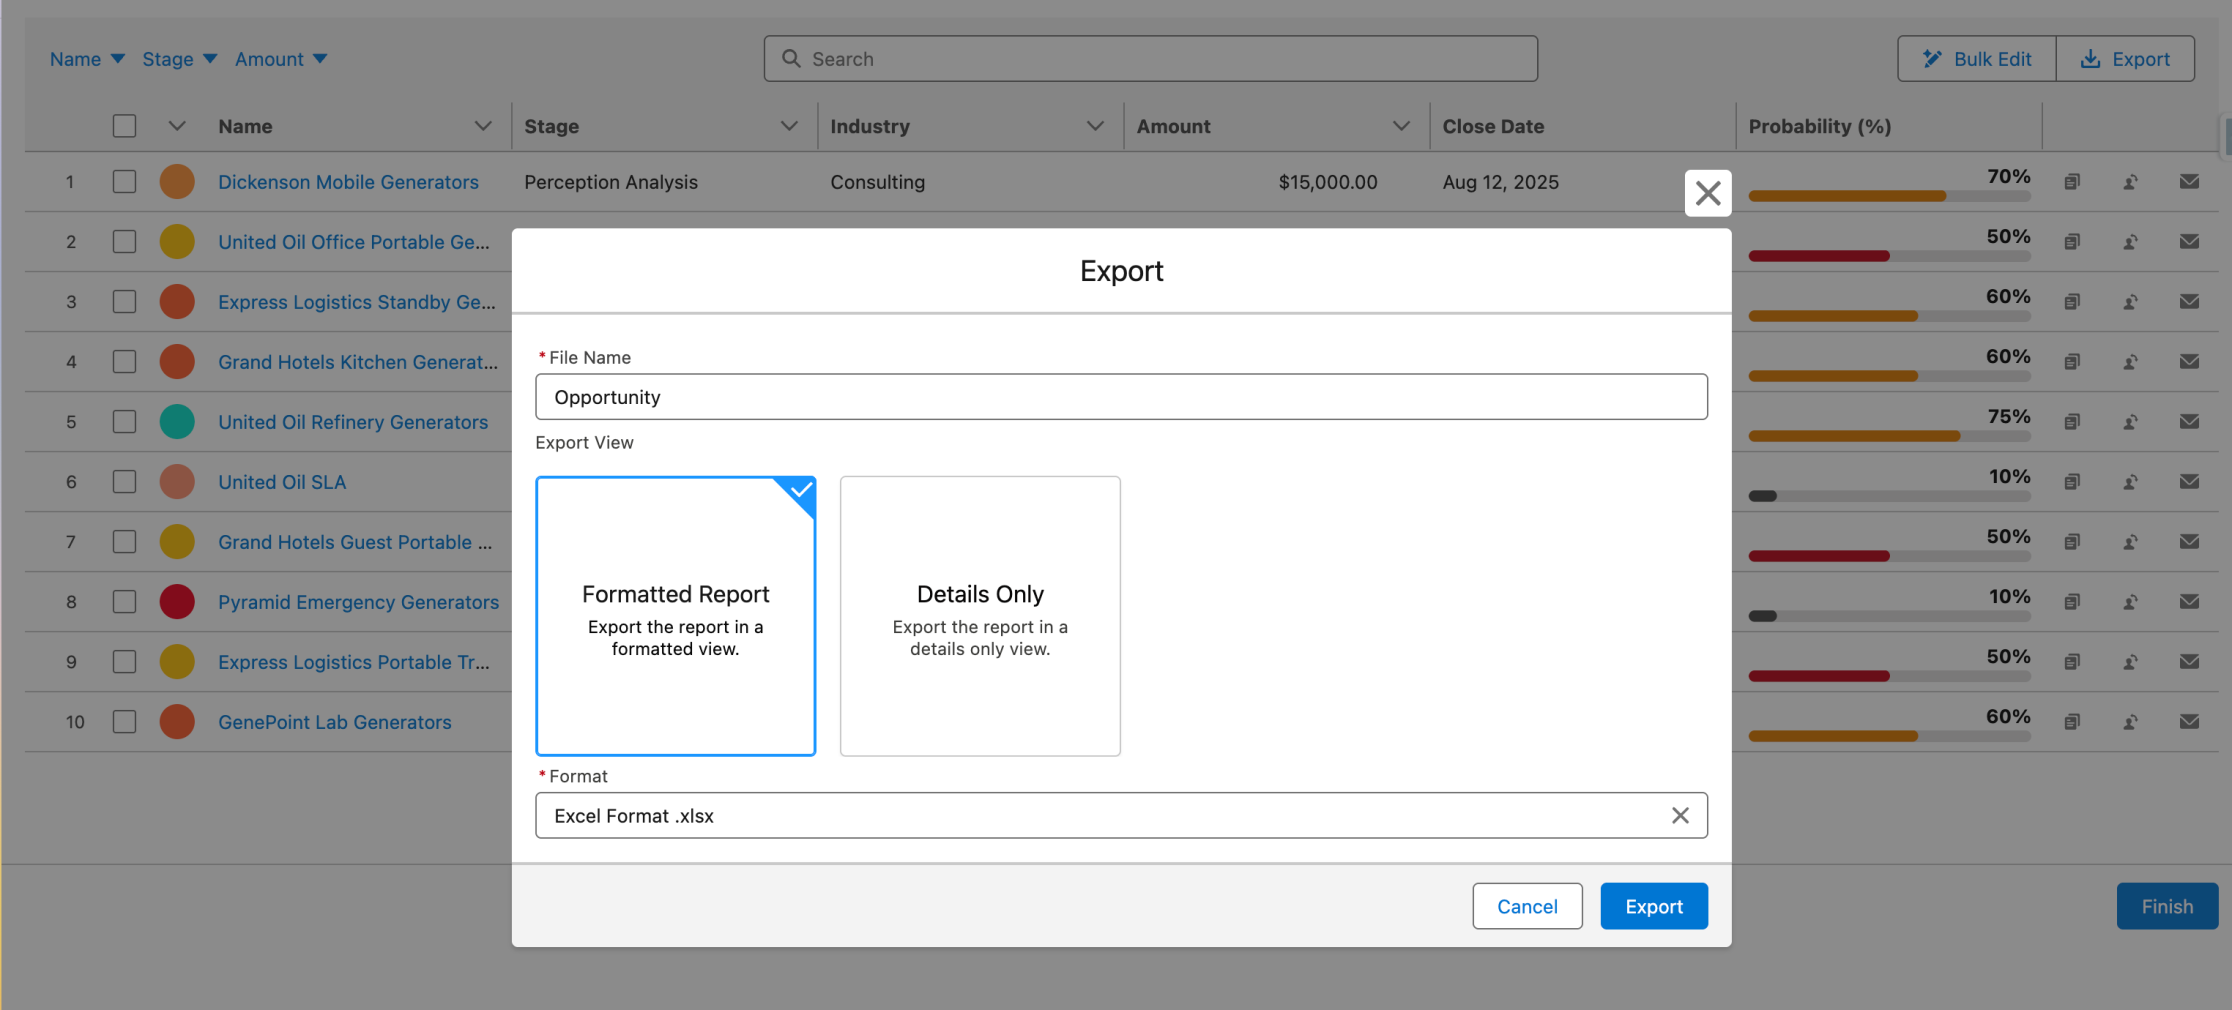
The same release added windowed pagination, which is what keeps a long table quick, plus clickable avatars and logos and a row-click interaction so the whole row can trigger something.
Pipeline grouped by stage. Every group sums itself.
Run a pivot table on a flow screen
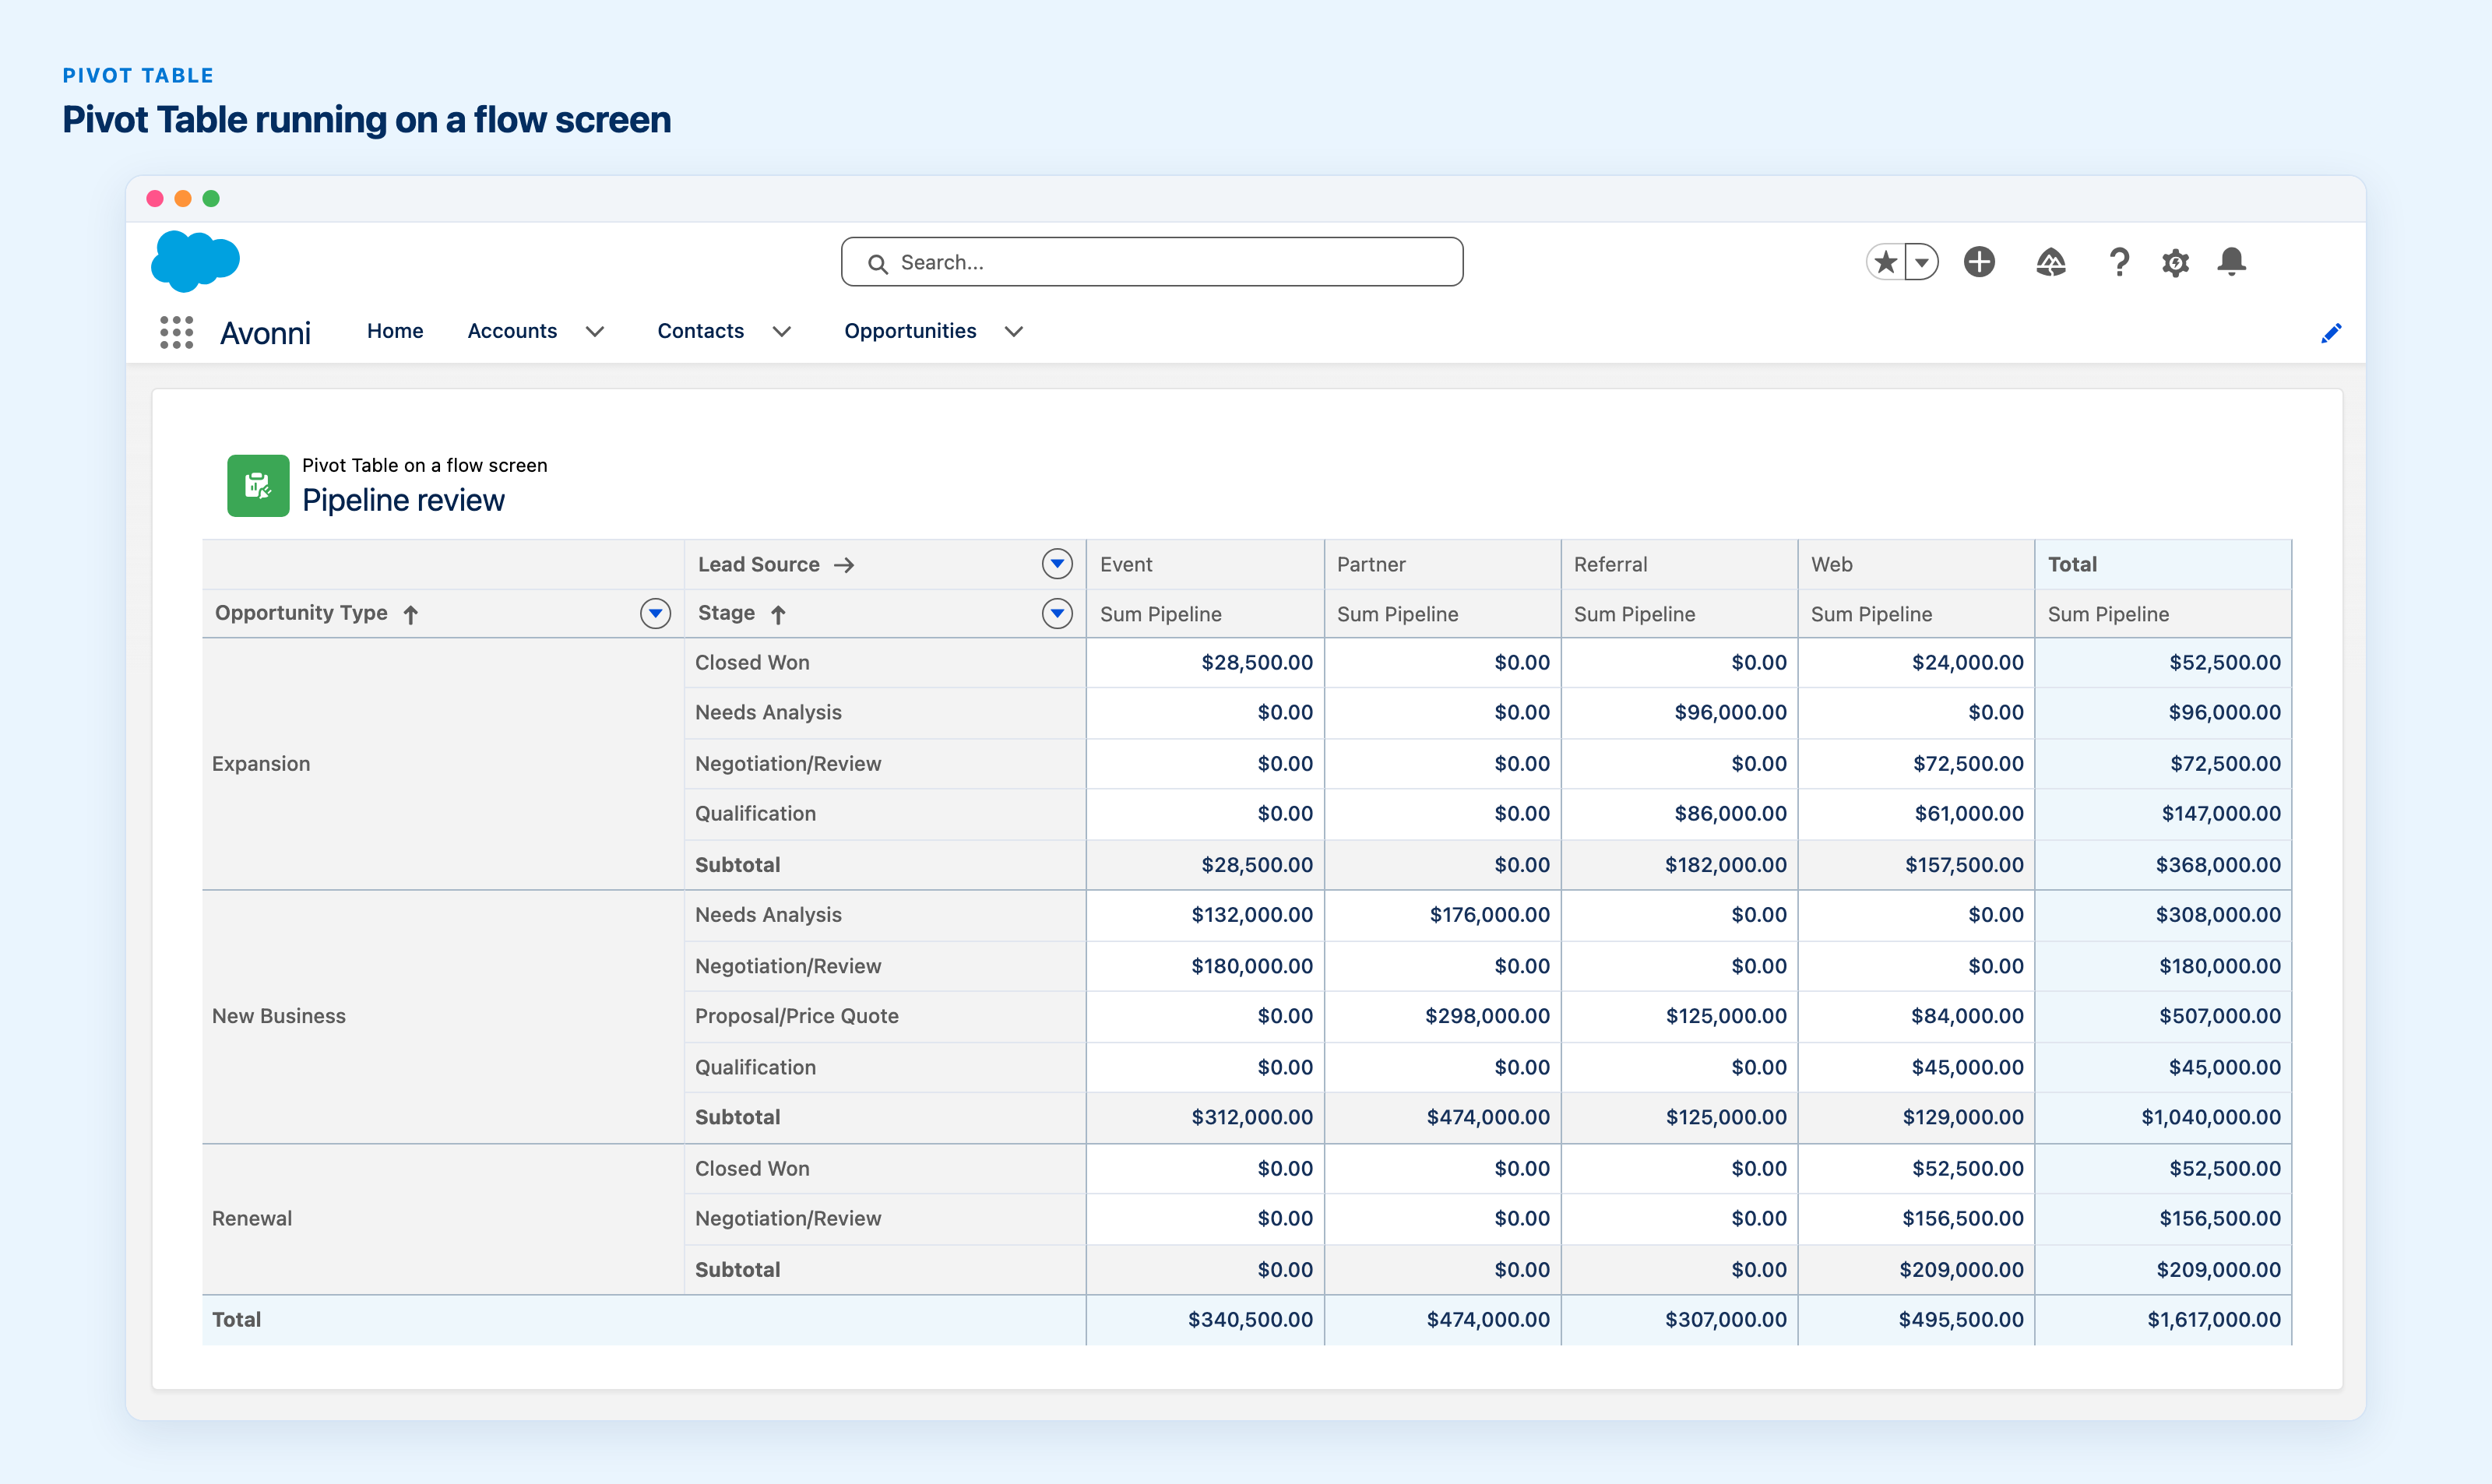
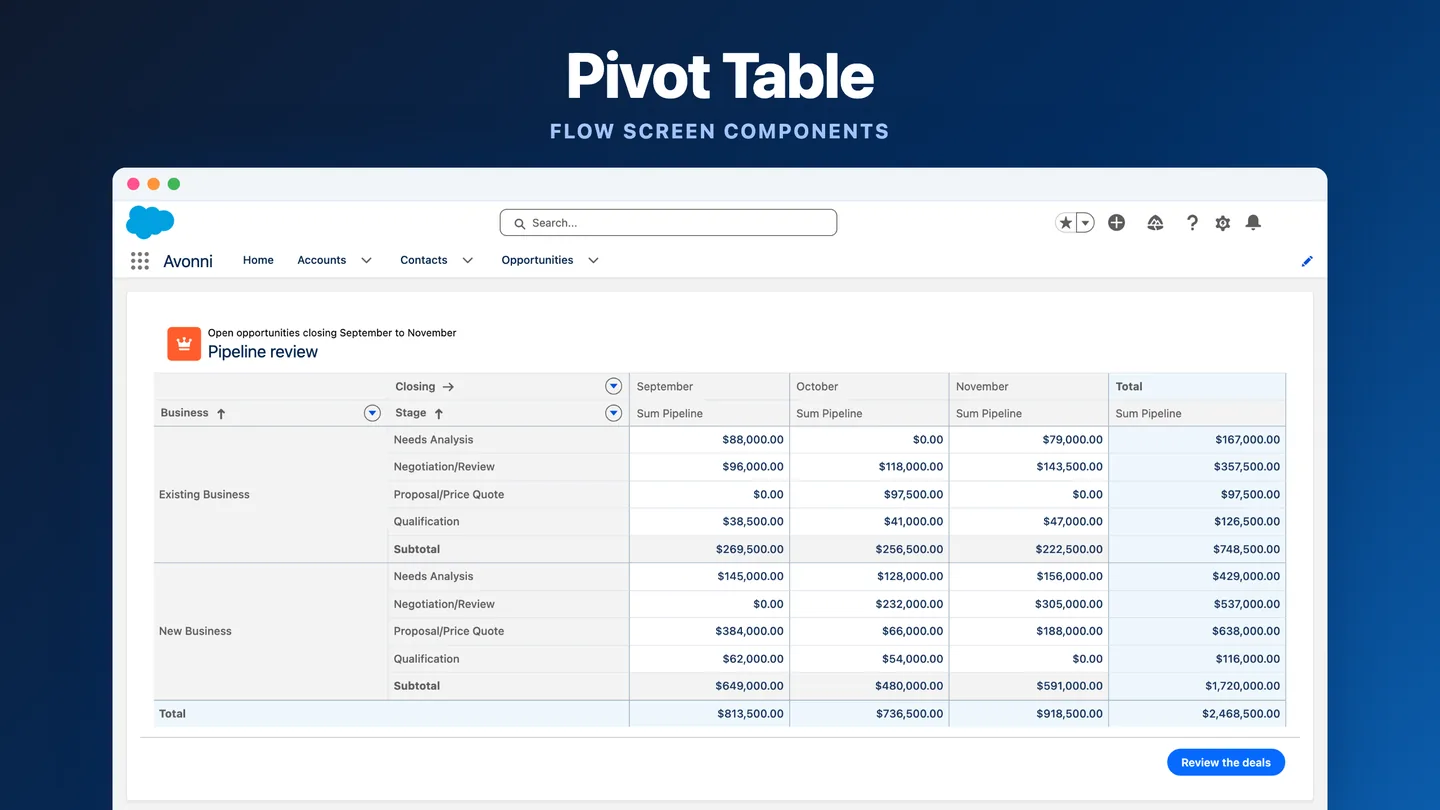
Also in July: the Pivot Table became available as a Flow screen component.
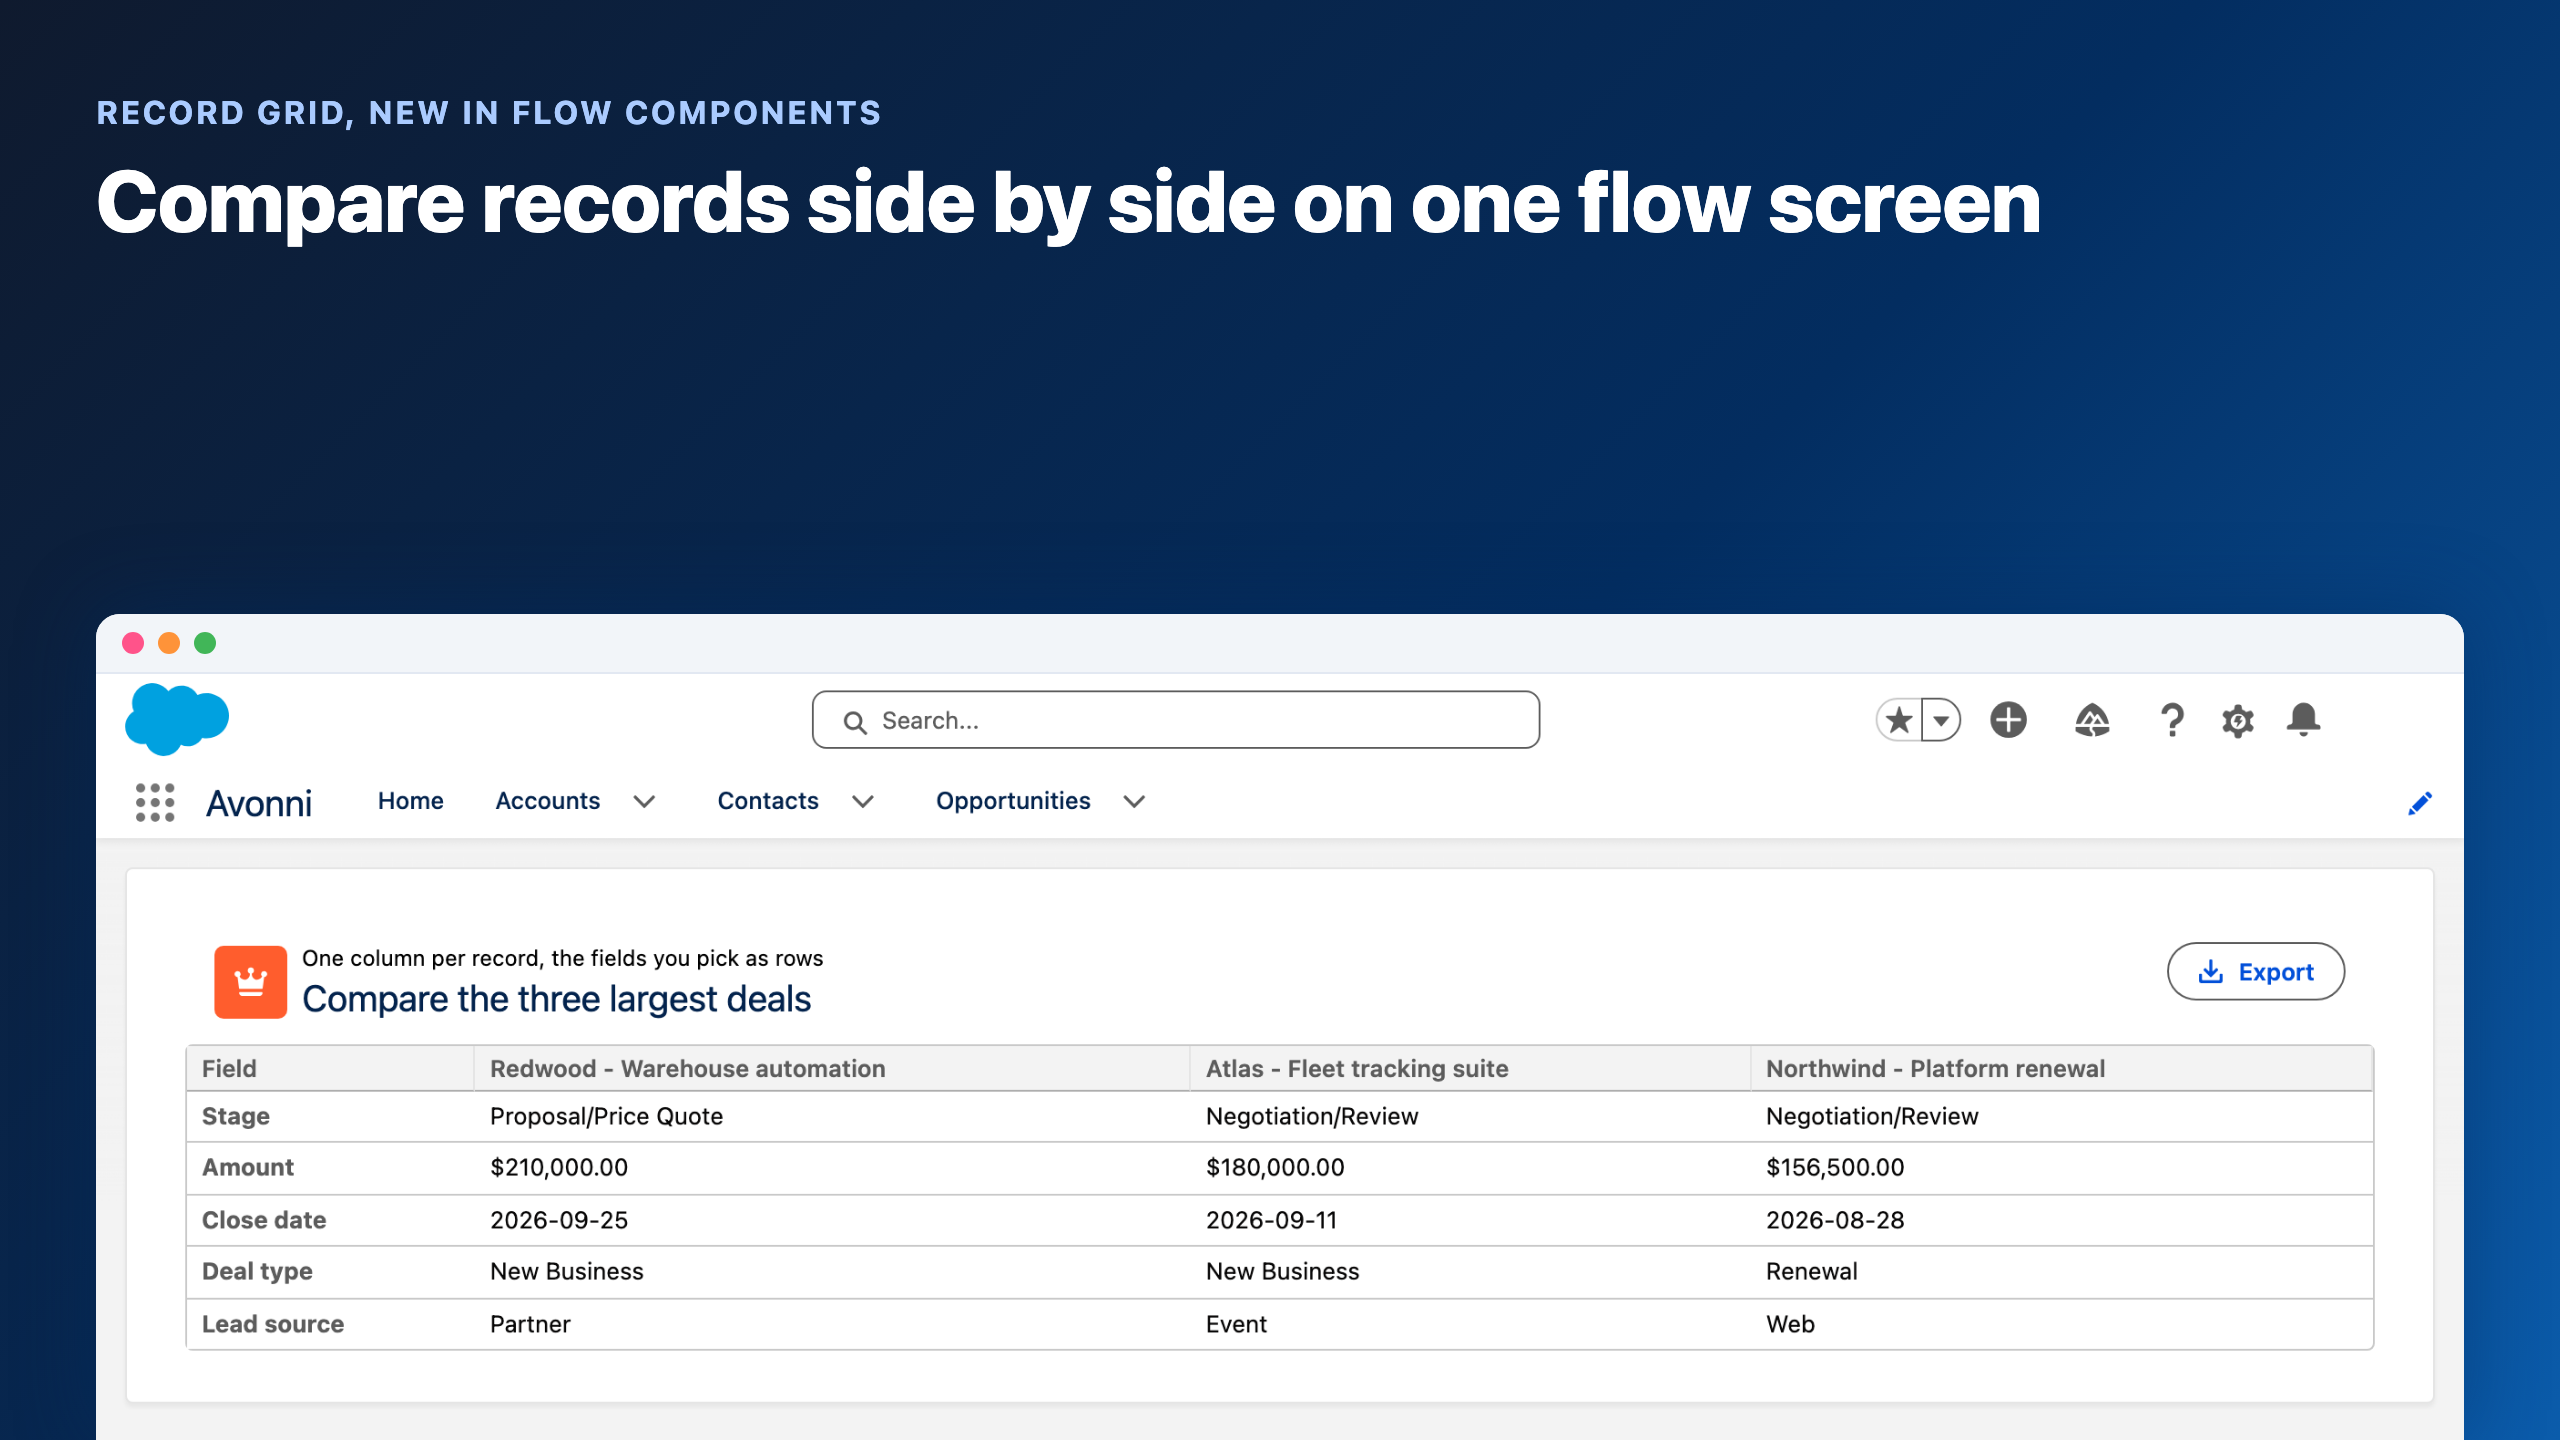
The reason that matters is sequencing. A screen flow that asks somebody to make a decision can now show them the cross-tab before the decision instead of after it, on the screen where the choice happens. No detour to a report, no second tab, no "I will check and come back to this".
Pipeline review as a flow screen. Captured in a running screen flow.
Cut the trips off the page
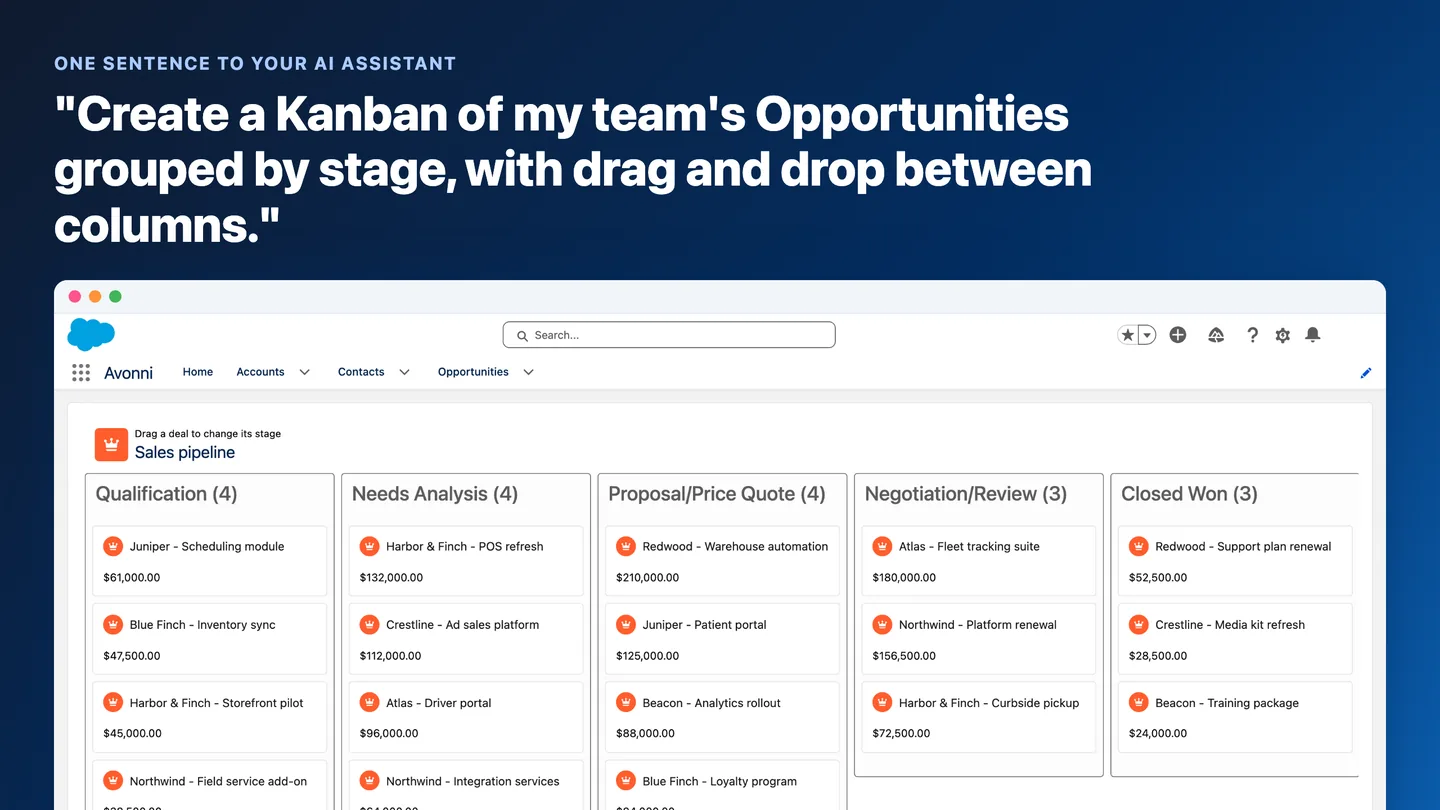
August is mostly about what a user no longer has to leave the page to do.
None of those four photograph well, which is why this section has no screenshot. A link looks like text in a still, and a drag is a drag.
The small ones that add up
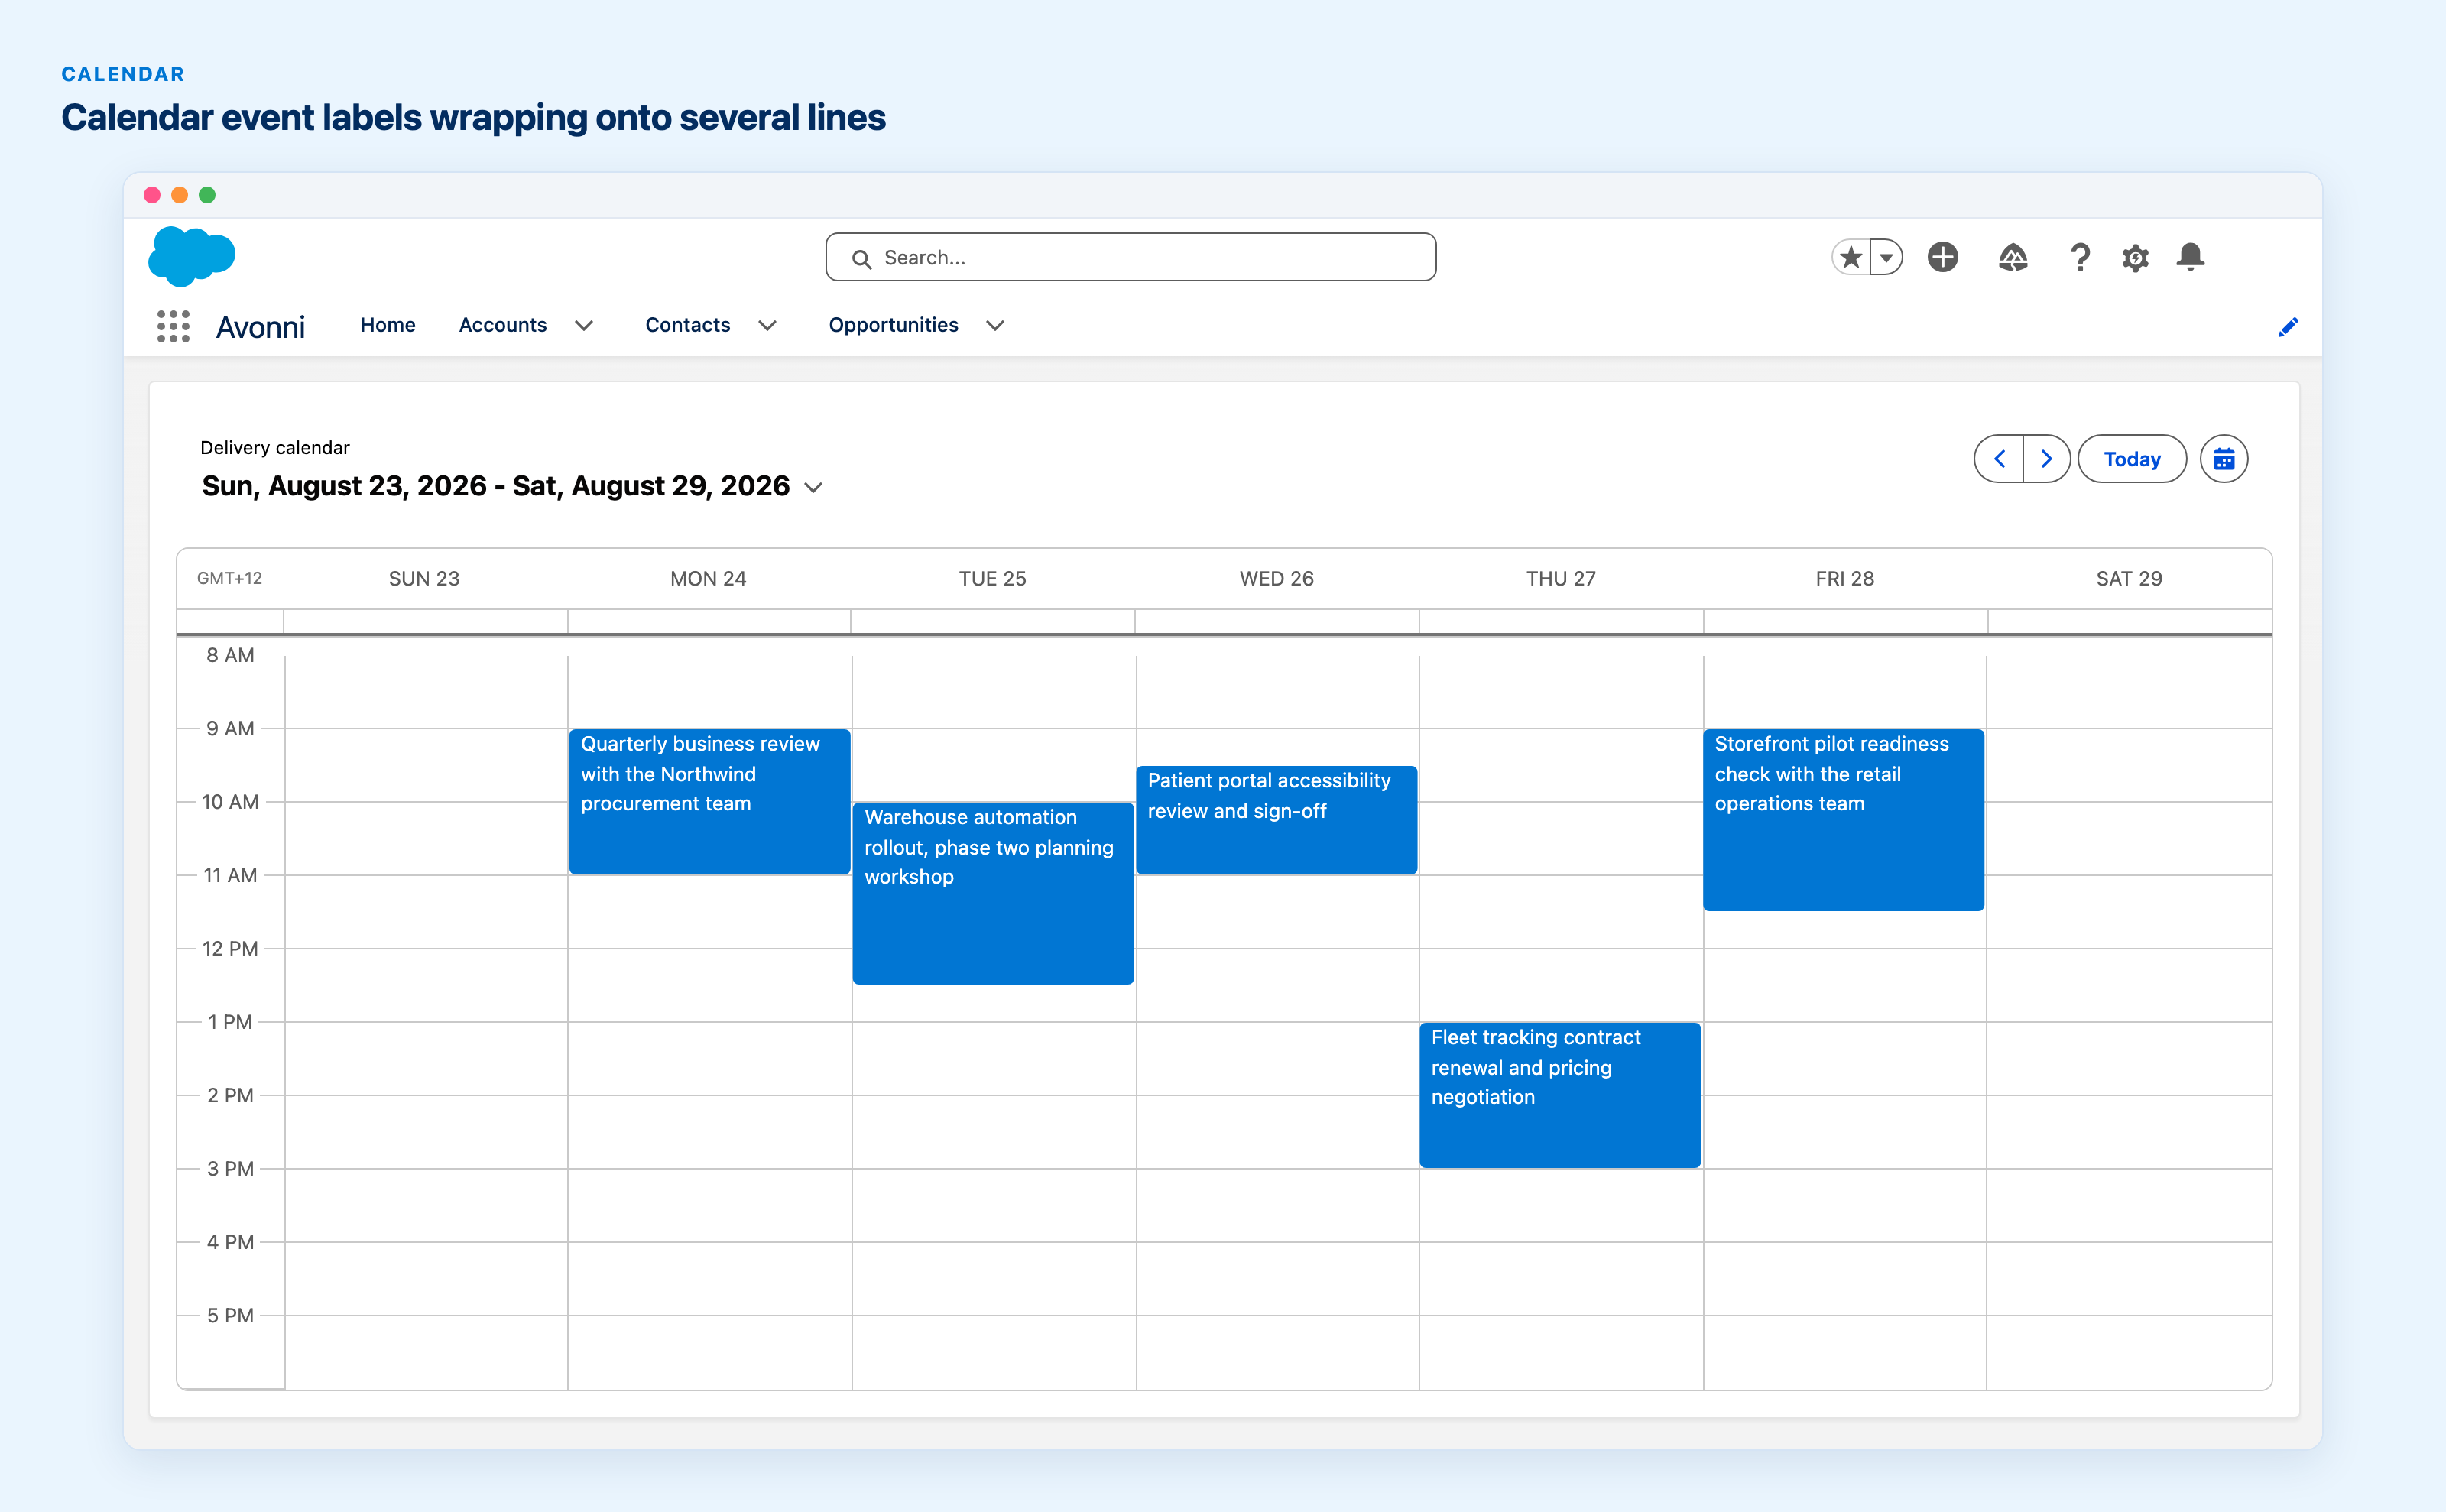
Calendar and Scheduler event labels wrap over several lines now instead of being cut at the tile edge. If your event titles carry a customer name and a subject, you could not read either one before.
Event labels over several lines instead of one truncated one.
In the same category: donut segments take configurable spacing between them, time fields let you set the interval the dropdown offers rather than accepting the fifteen minute default, and the Component Builder preview stopped reloading the canvas.
July brought a longer list of these than August did:
Fixes landed across the Data Table, Map, Scheduler, Carousel, Pivot Table, Record Picker and others, in both releases.
Getting it into your org
It is a package upgrade. Sandbox, a pass over the flows and pages you care about, then production.
The four suites version independently, so read the tags on each item rather than the release date.
Tree Grid is the clearest case of why the tags matter: it was in Flow in July and in the Dynamic Component Builder in August, so if you run one of the two packages, you got one of the two dates.
Both releases, in one place
The current changelog carries every item, its suite tags and the install links for all four packages. The July 10 release is archived beside it. That page is rewritten on every release, so it is the first place the next one appears.
One question, and it is a real one. Which of these did you already build by hand before we shipped it? That is the one we want to hear about, because it tells us where to point the next release.






%20(Vignette%20YouTube)%20(81).png)