The October 31 releases are out: LWC Components 1.14, Dynamic Components 1.57, Flow Components 6.35 and Experience Components 1.30. Two new chart types lead the way, a map that shades each region by a number and a word cloud that sizes each word by one. LWC developers get a data-driven Tree Grid, and Experience sites get navigation that behaves on a phone.
October 31, 2026 versions
| LWC Components | 1.14 |
| Dynamic Components | 1.57 |
| Flow Components | 6.35 |
| Experience Components | 1.30 |
Shade a map by the numbers behind each region
Ask where your shipments go and you usually get a bar chart with a bar per province, sorted by count. It answers the question, but you still have to picture the map in your head.
The Chart component now has a Choropleth Map type that draws the map for you. Each region is shaded by a measure, with a gradient legend, tooltips, a total and optional zoom. Start from a built-in world, continent or country map and split it down to countries, or to states and provinces. If your territories follow other borders, point the chart to your own GeoJSON or TopoJSON map, by URL or as a file stored in Salesforce. Records land on the map through a region name field or through latitude and longitude.
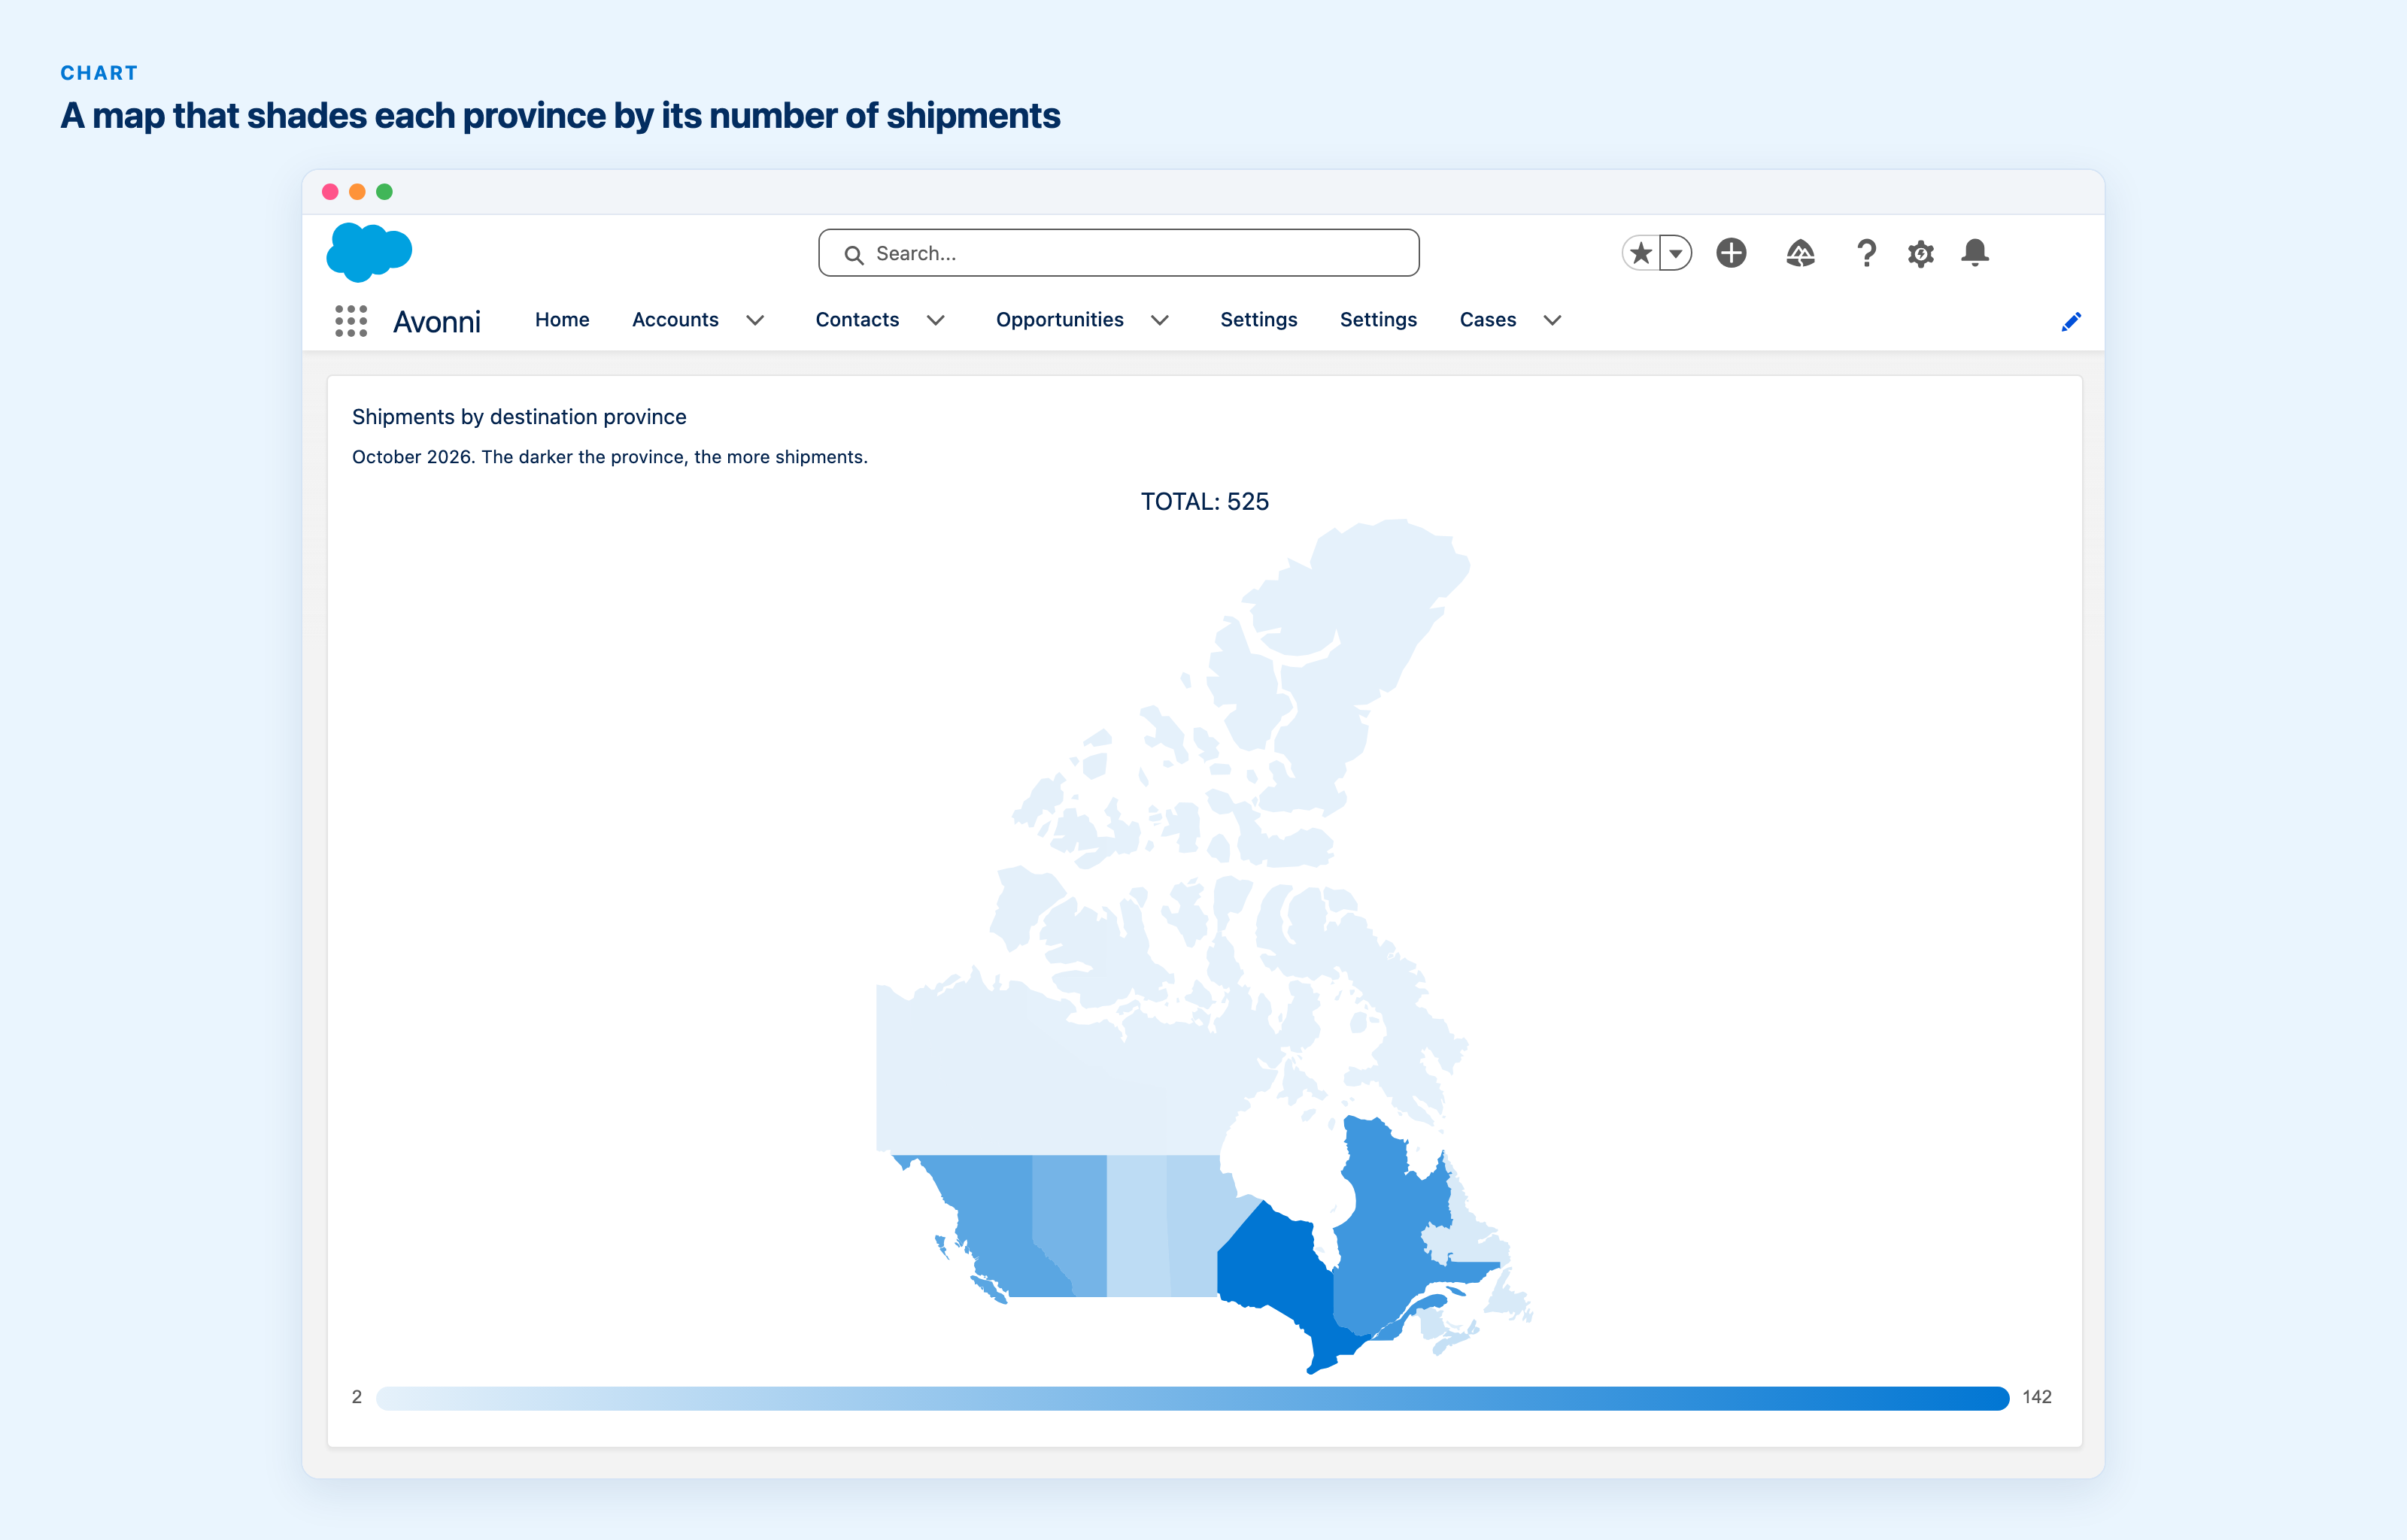
Shipments by destination province, each province shaded by its count, with a gradient legend and a total.
One thing for the admin: a map loaded from a URL only works once that URL is in the org's trusted URLs. Chart in Dynamic Components · Chart in Flow Components
Size words by what they are worth
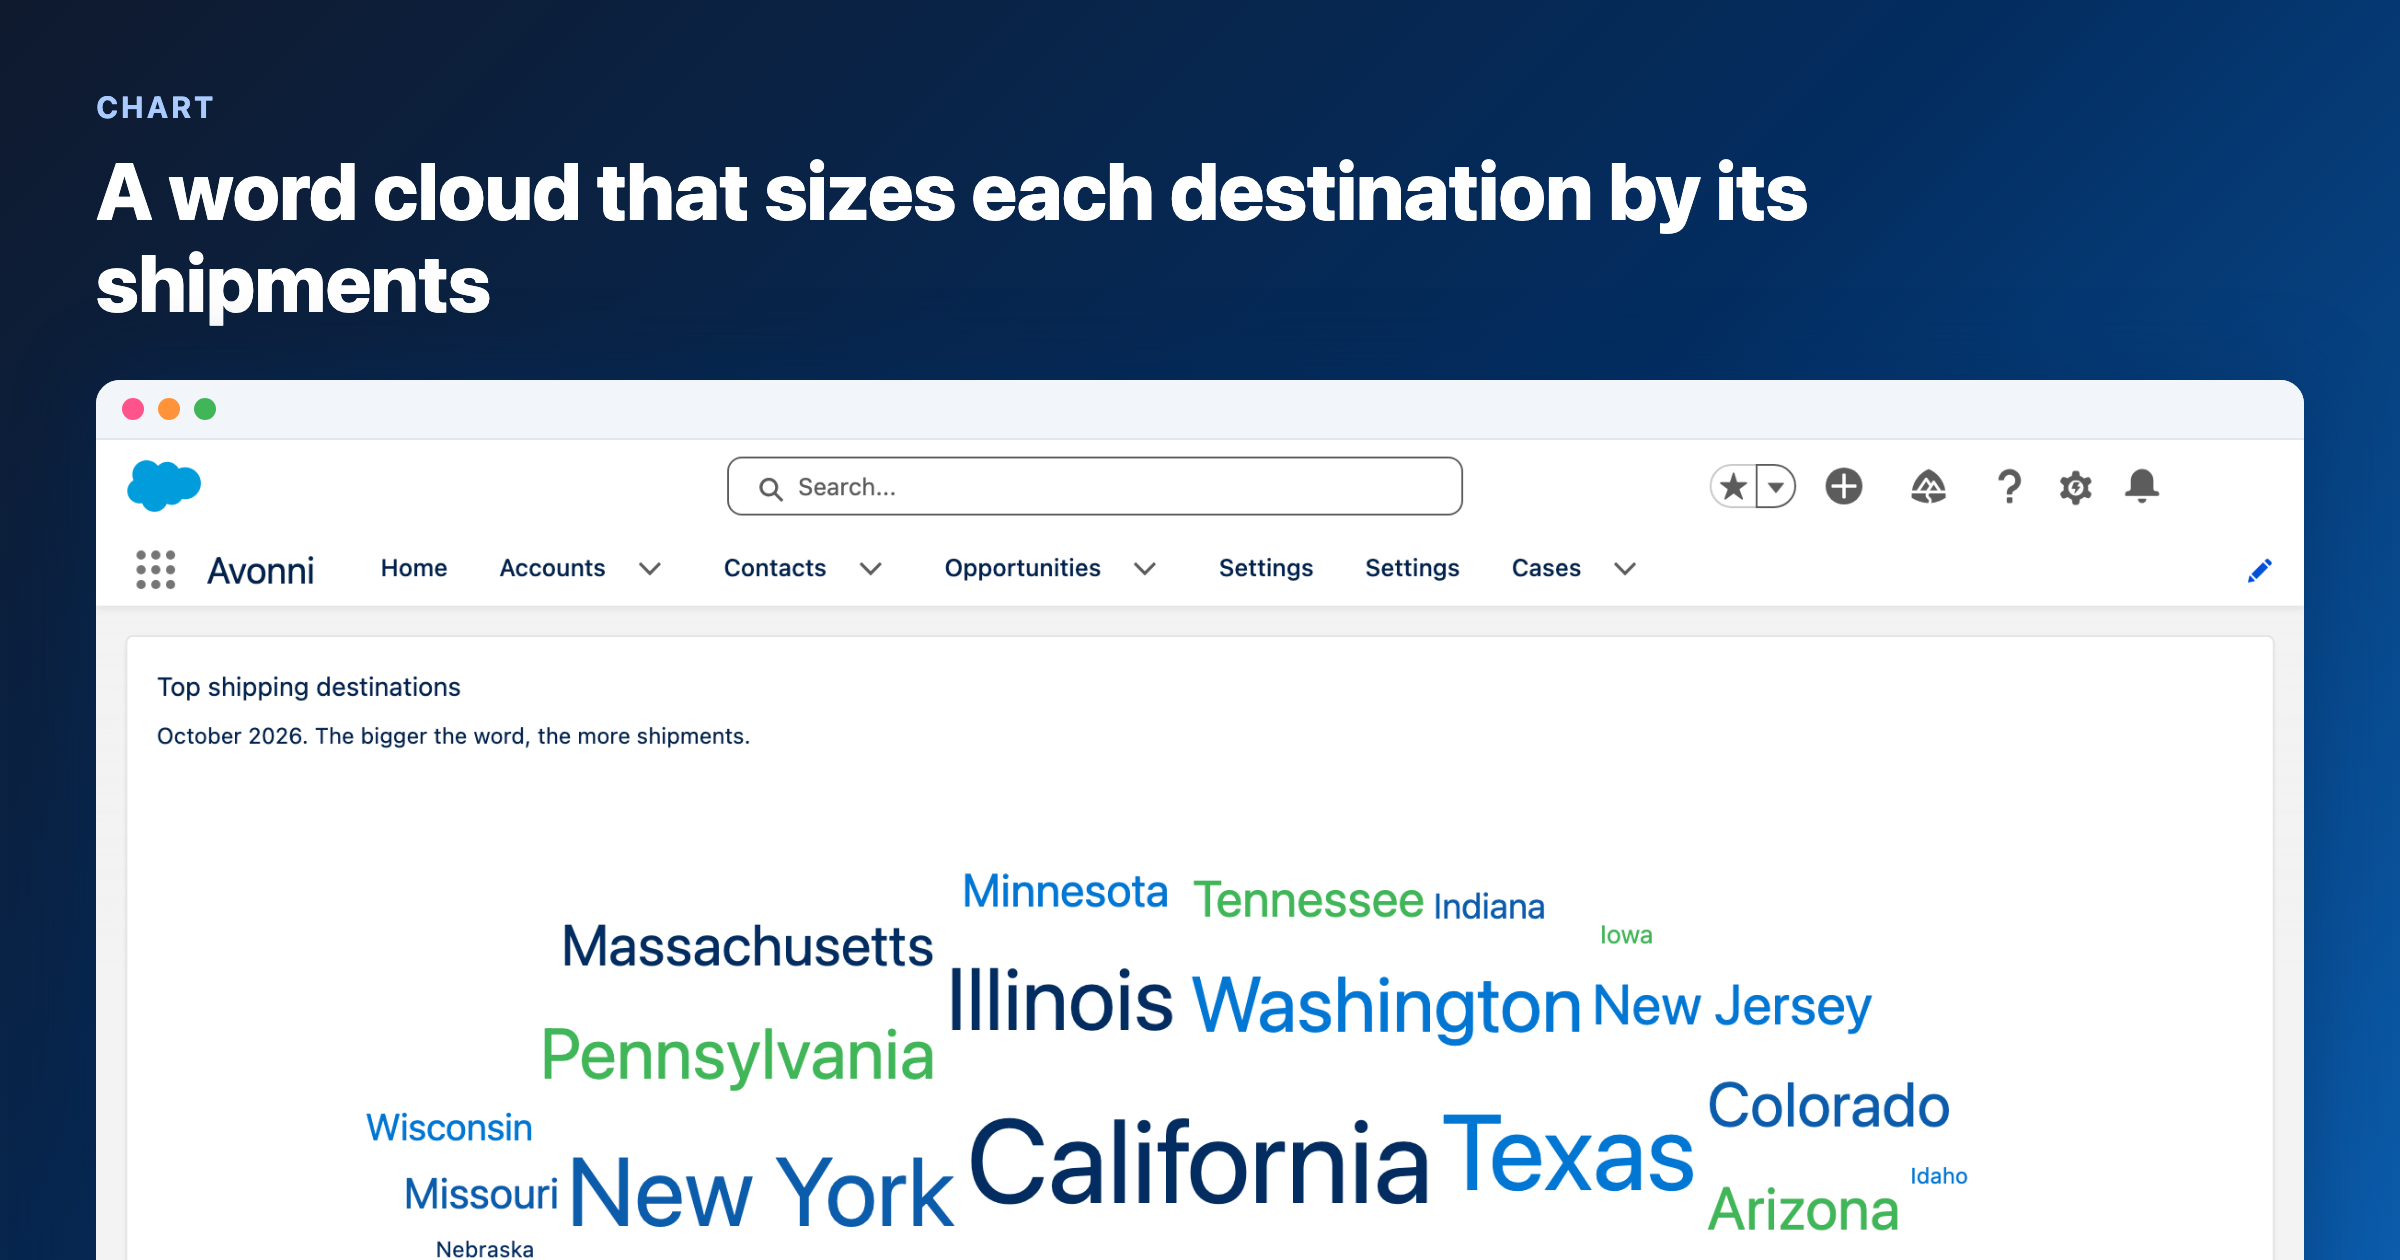
The second new type is a Word Cloud. Each word is sized by a measure, so lead sources sized by the amount behind them show you at a glance where the money comes from. The words can come from one or more fields and run horizontally, or horizontally and vertically. You set the smallest and largest font size, or turn on Fit All Words so every word finds a place. The font family lives in the chart styles.
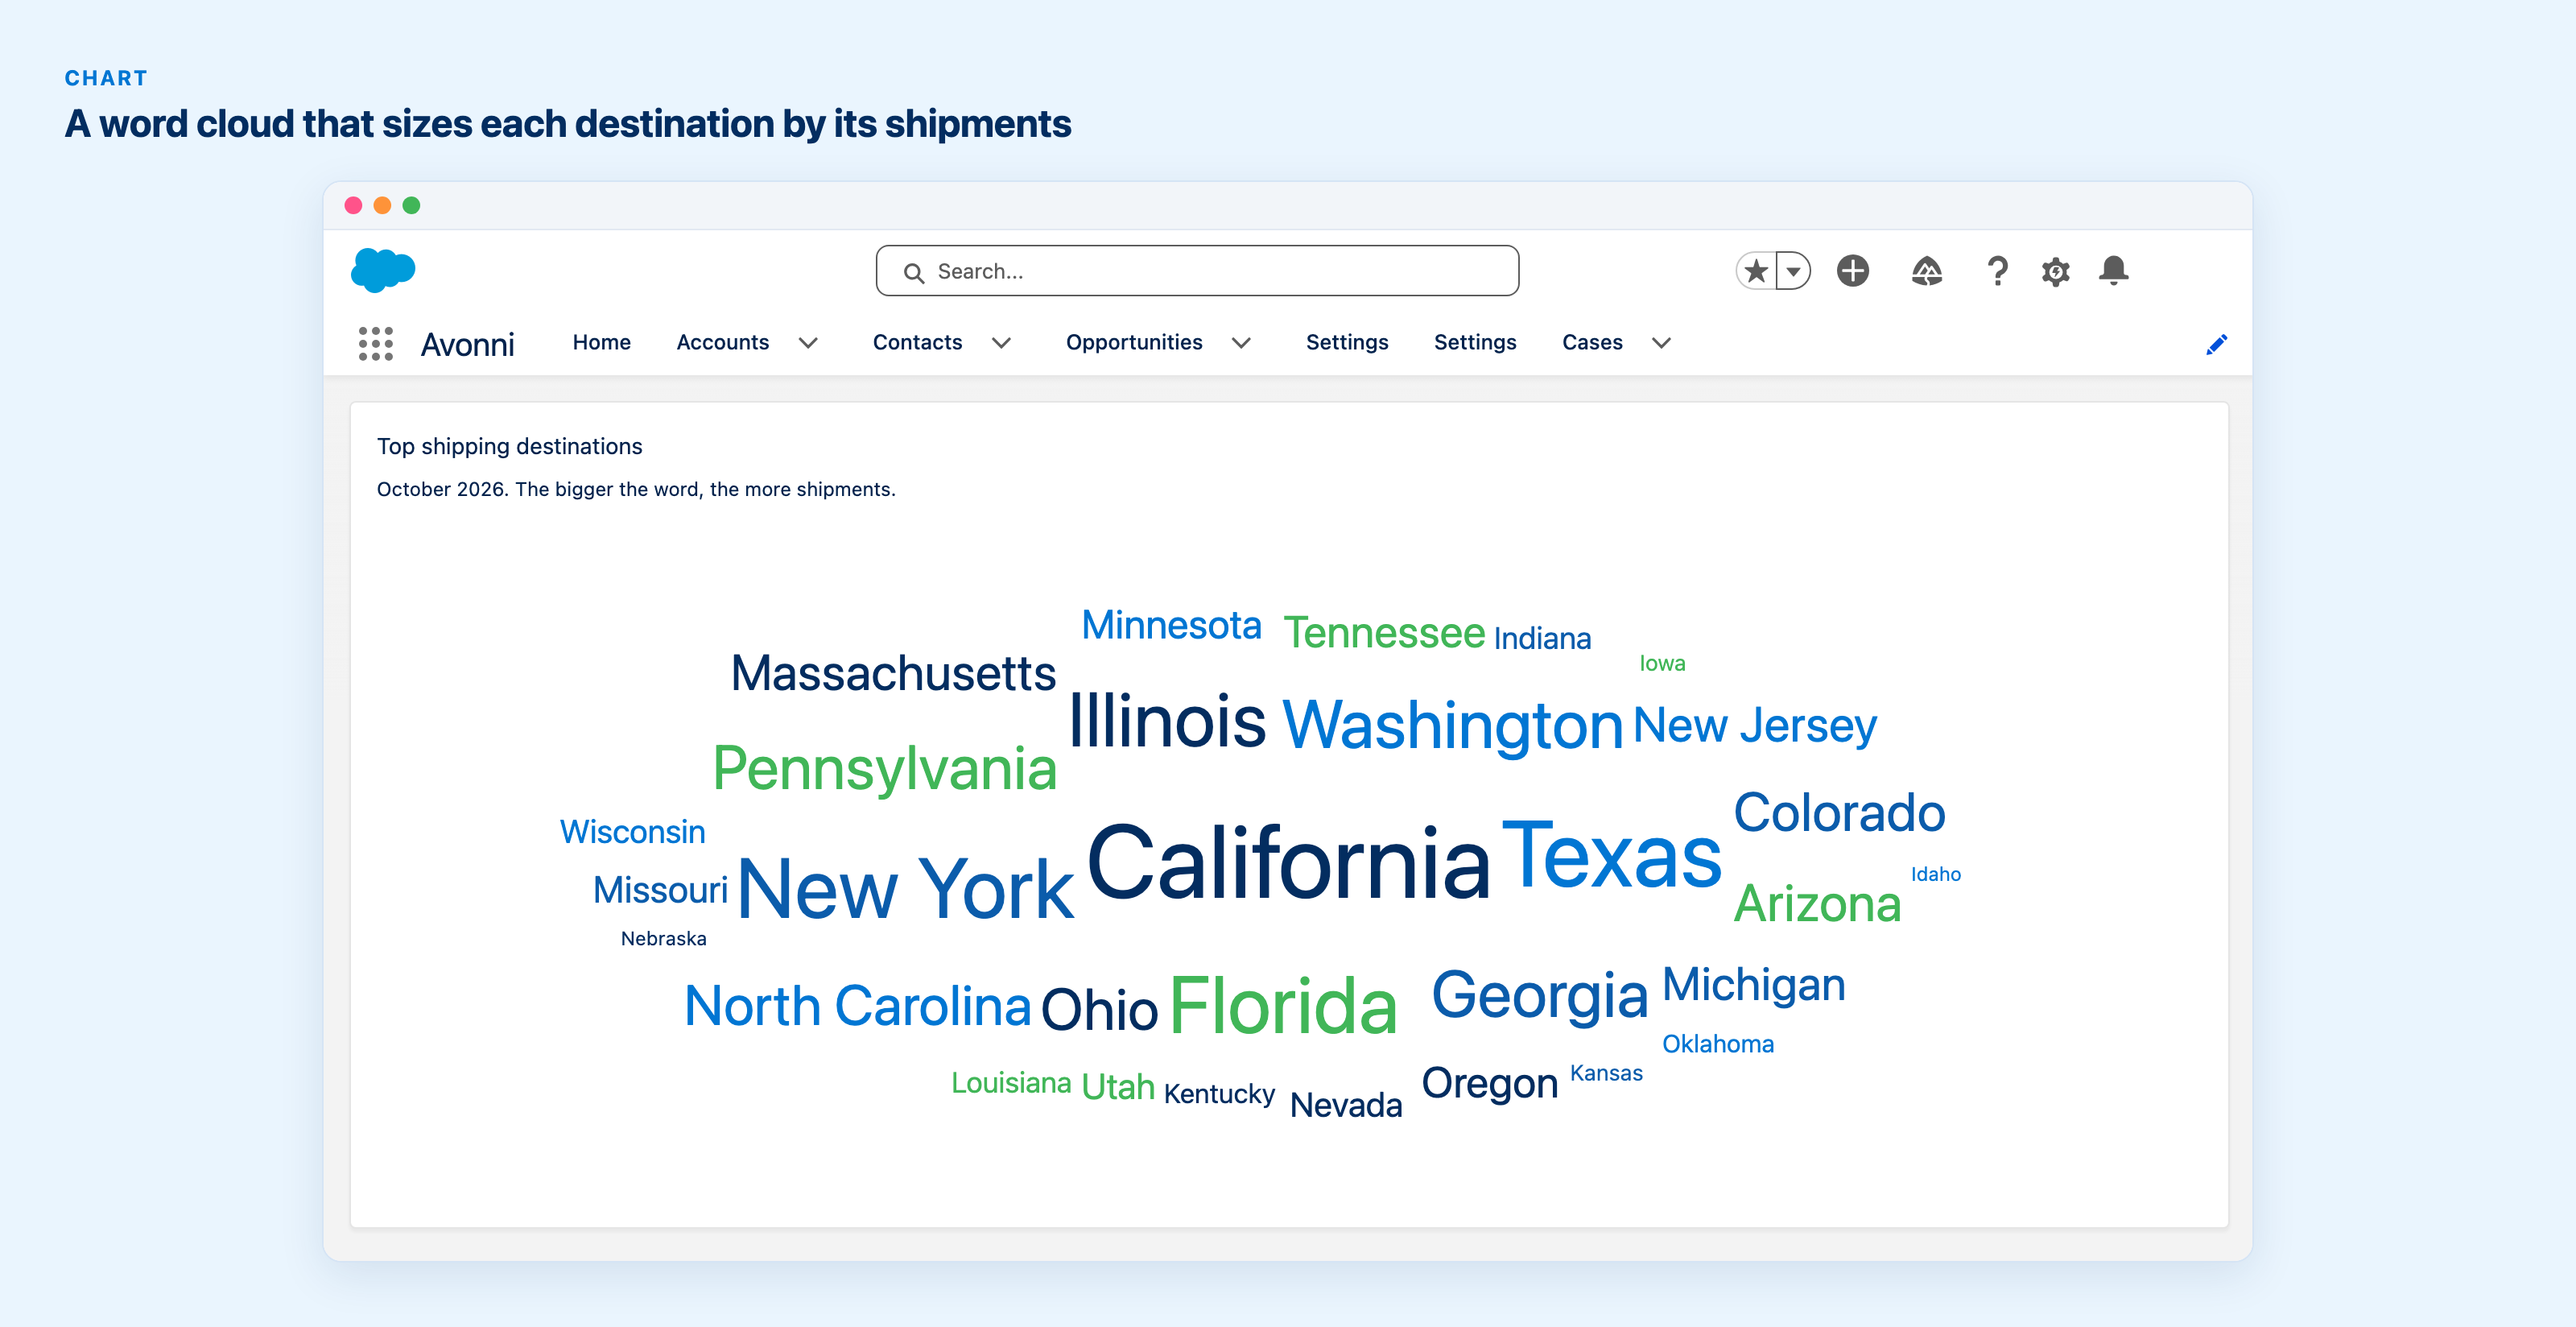
Shipping destinations, each word sized by the number of shipments behind it.
Both new types are in Dynamic Components and Flow Components. On an Experience site, you reach them through a Dynamic Component.
Charts that let Salesforce do the counting
A chart bound to a query used to read every record behind it before it could draw a single bar. Now Salesforce does the grouping and the measures, and the chart reads one row per group. A page with several charts on the same data loads faster as a result. Measures Salesforce cannot compute in a query, a median for instance, still read the records. The charts themselves look exactly as before.
One new setting comes with it. Each measure has Treat Blank Value As Zero, so records with an empty value count as zero. That matters for averages: with the setting on, an Average divides by every record, blanks included.
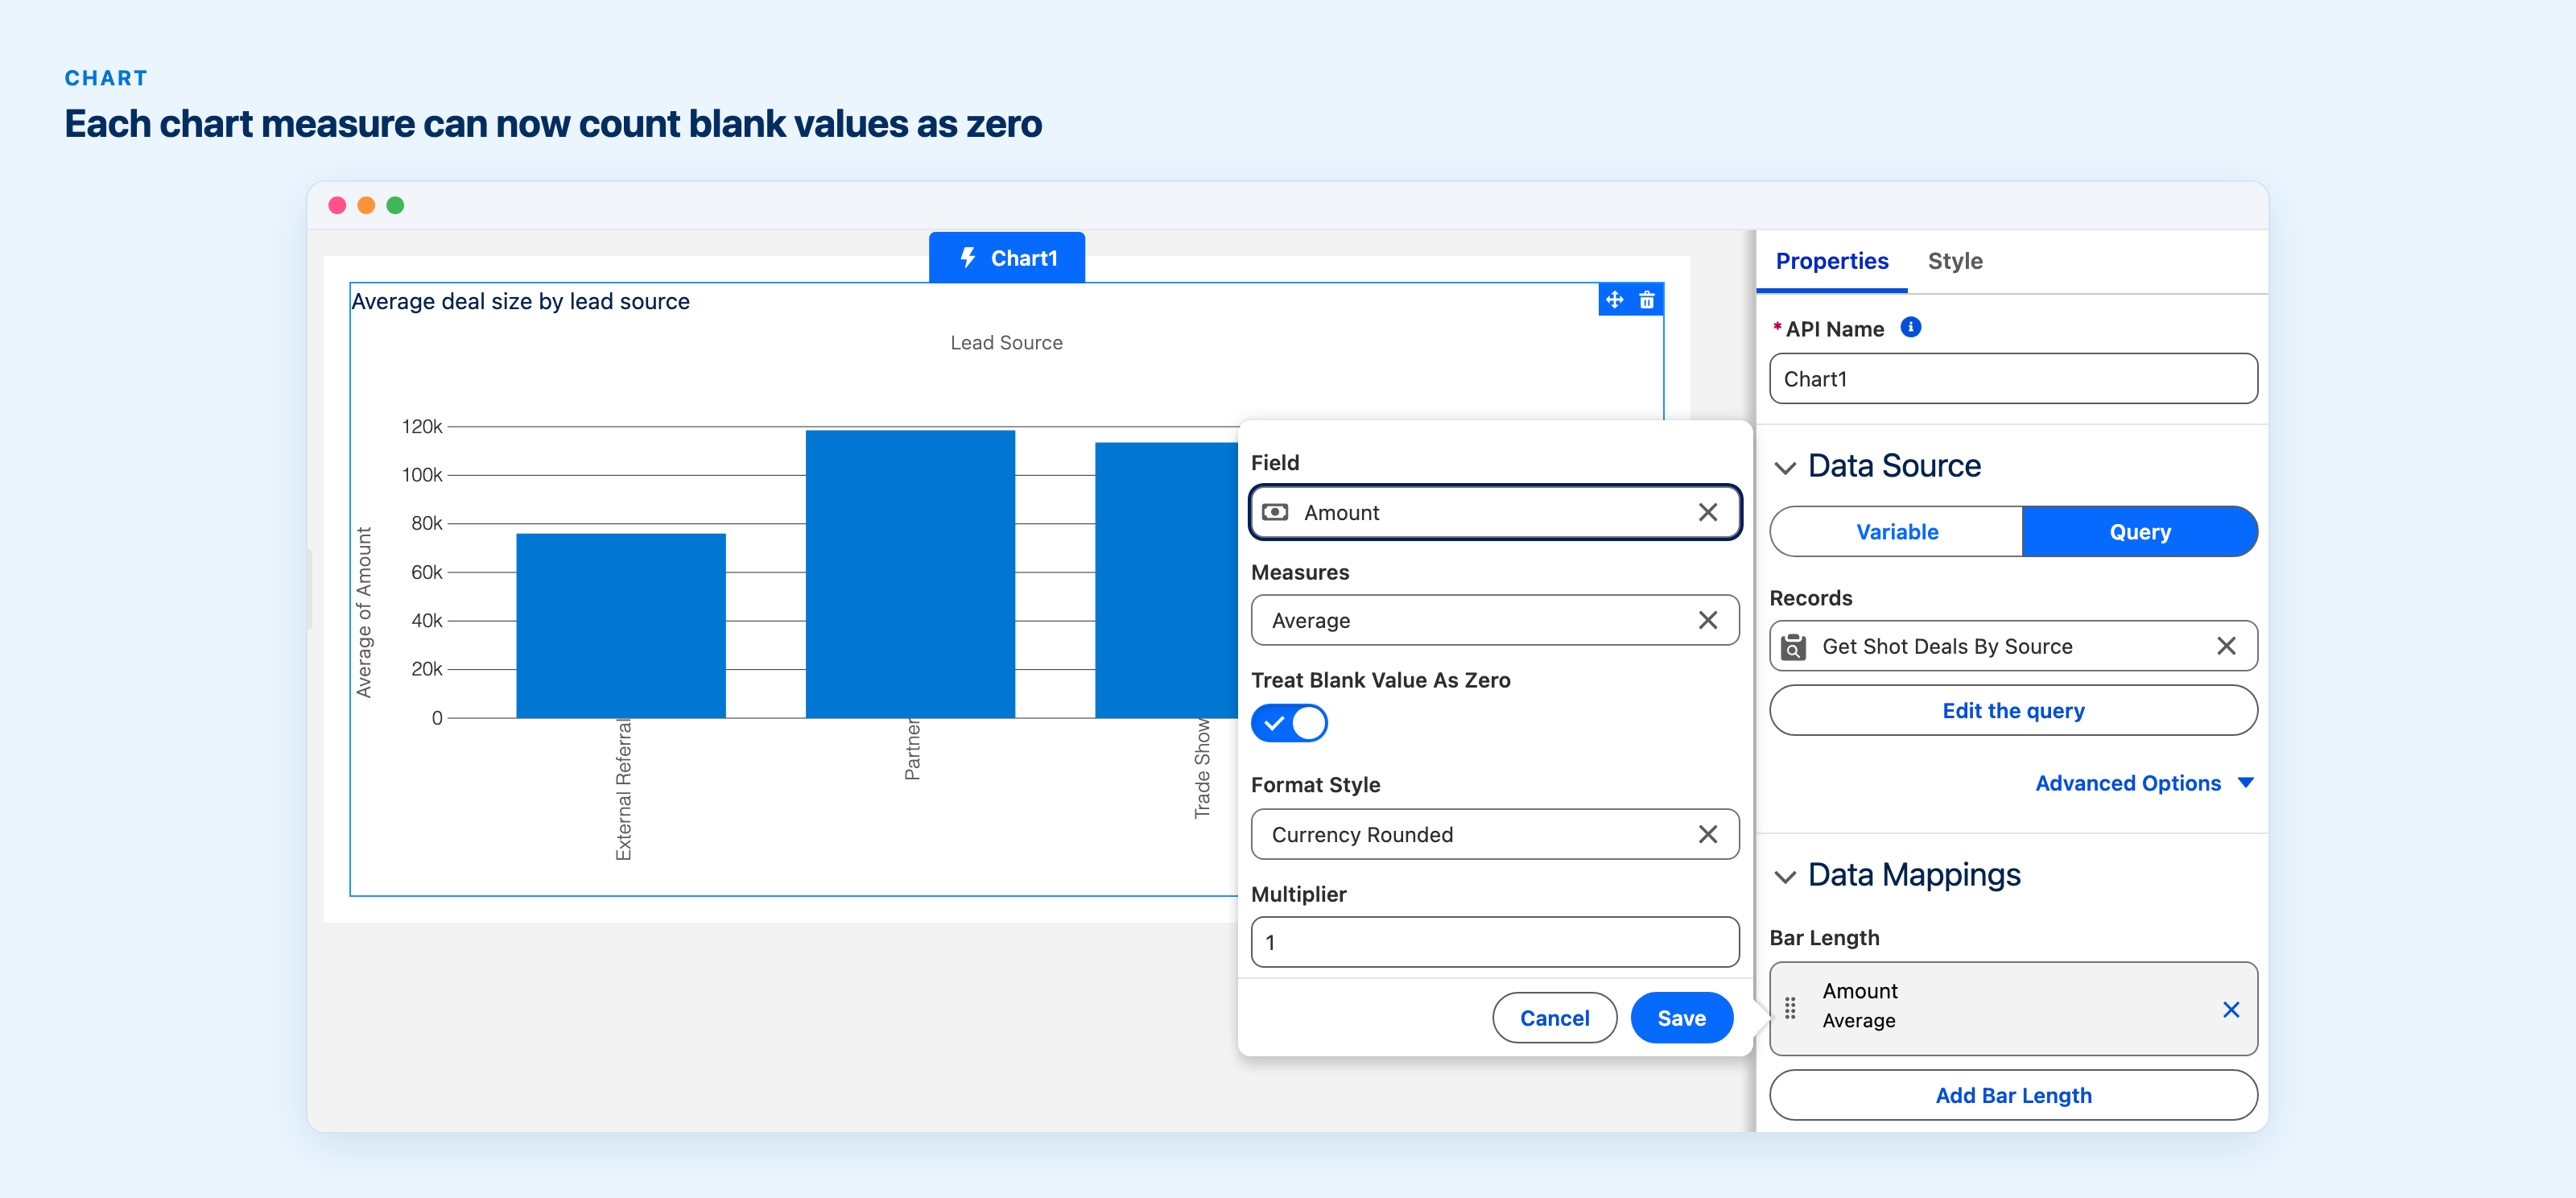
In the Builder, a chart measure with the new Treat Blank Value As Zero setting turned on: records with an empty value count as zero in the measure.
A data-driven Tree Grid for LWC developers
If you build your own Lightning Web Components, LWC Components 1.14 adds a data-driven Tree Grid. Give it a parent query and child queries and it shows related records as nested rows: accounts with their opportunities, accounts with their contacts. It can also take rows directly, each one carrying its children. You get column widths, sorting, column header actions, a total record count and a count of children on each row.
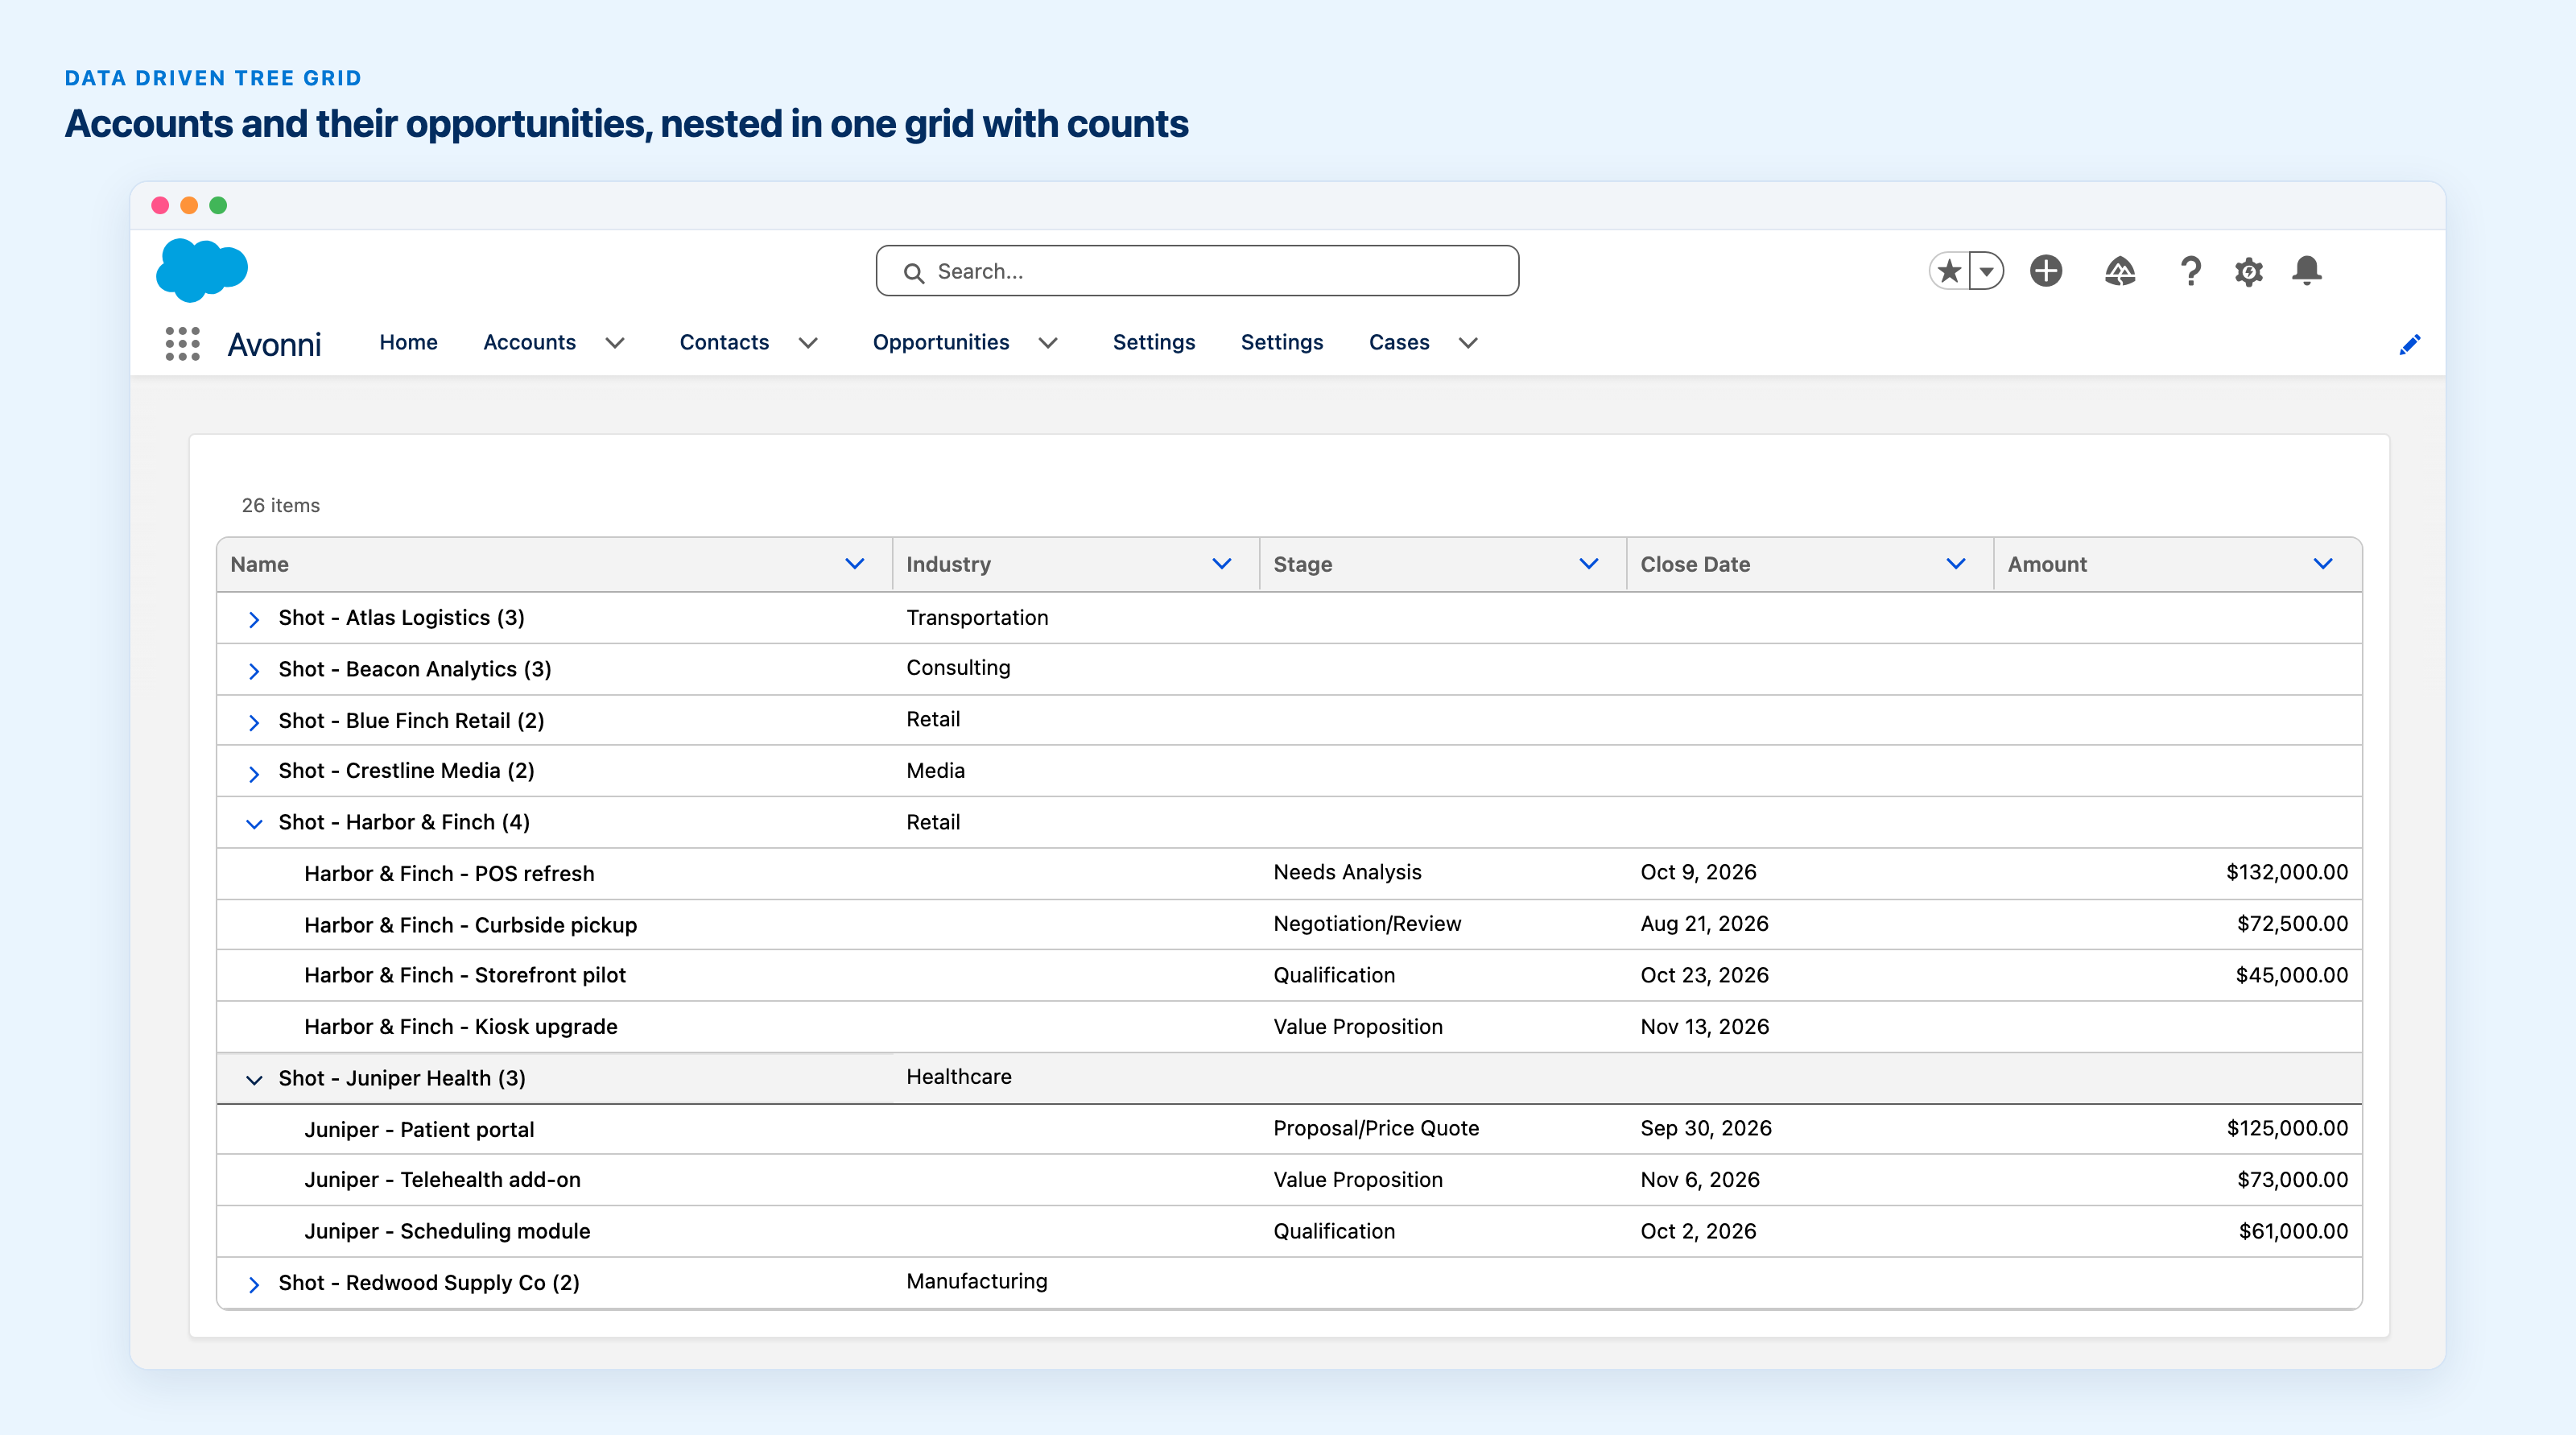
Accounts and their opportunities in one grid, with the total number of items and each account's number of children.
Those counts reach the no-code side as well. In all four suites, the Tree, the Tree Grid and the Relationship Graph get Show Total Number of Items, which counts every level of the hierarchy on the server. The Tree Grid also gets Show Number of Children, which prints each row's child count beside its label. Tree Grid in Dynamic Components · Tree Grid in Flow Components
Experience sites that work on a phone
Partners open your portal on their phones, between two meetings. On a small screen, the Navigation component now has an option called Display Actions In Mobile Menu: the actions slot leaves the header and moves into the open mobile menu, so the header stays clean. The mobile menu also follows the device type now, phone or tablet, instead of the window width.
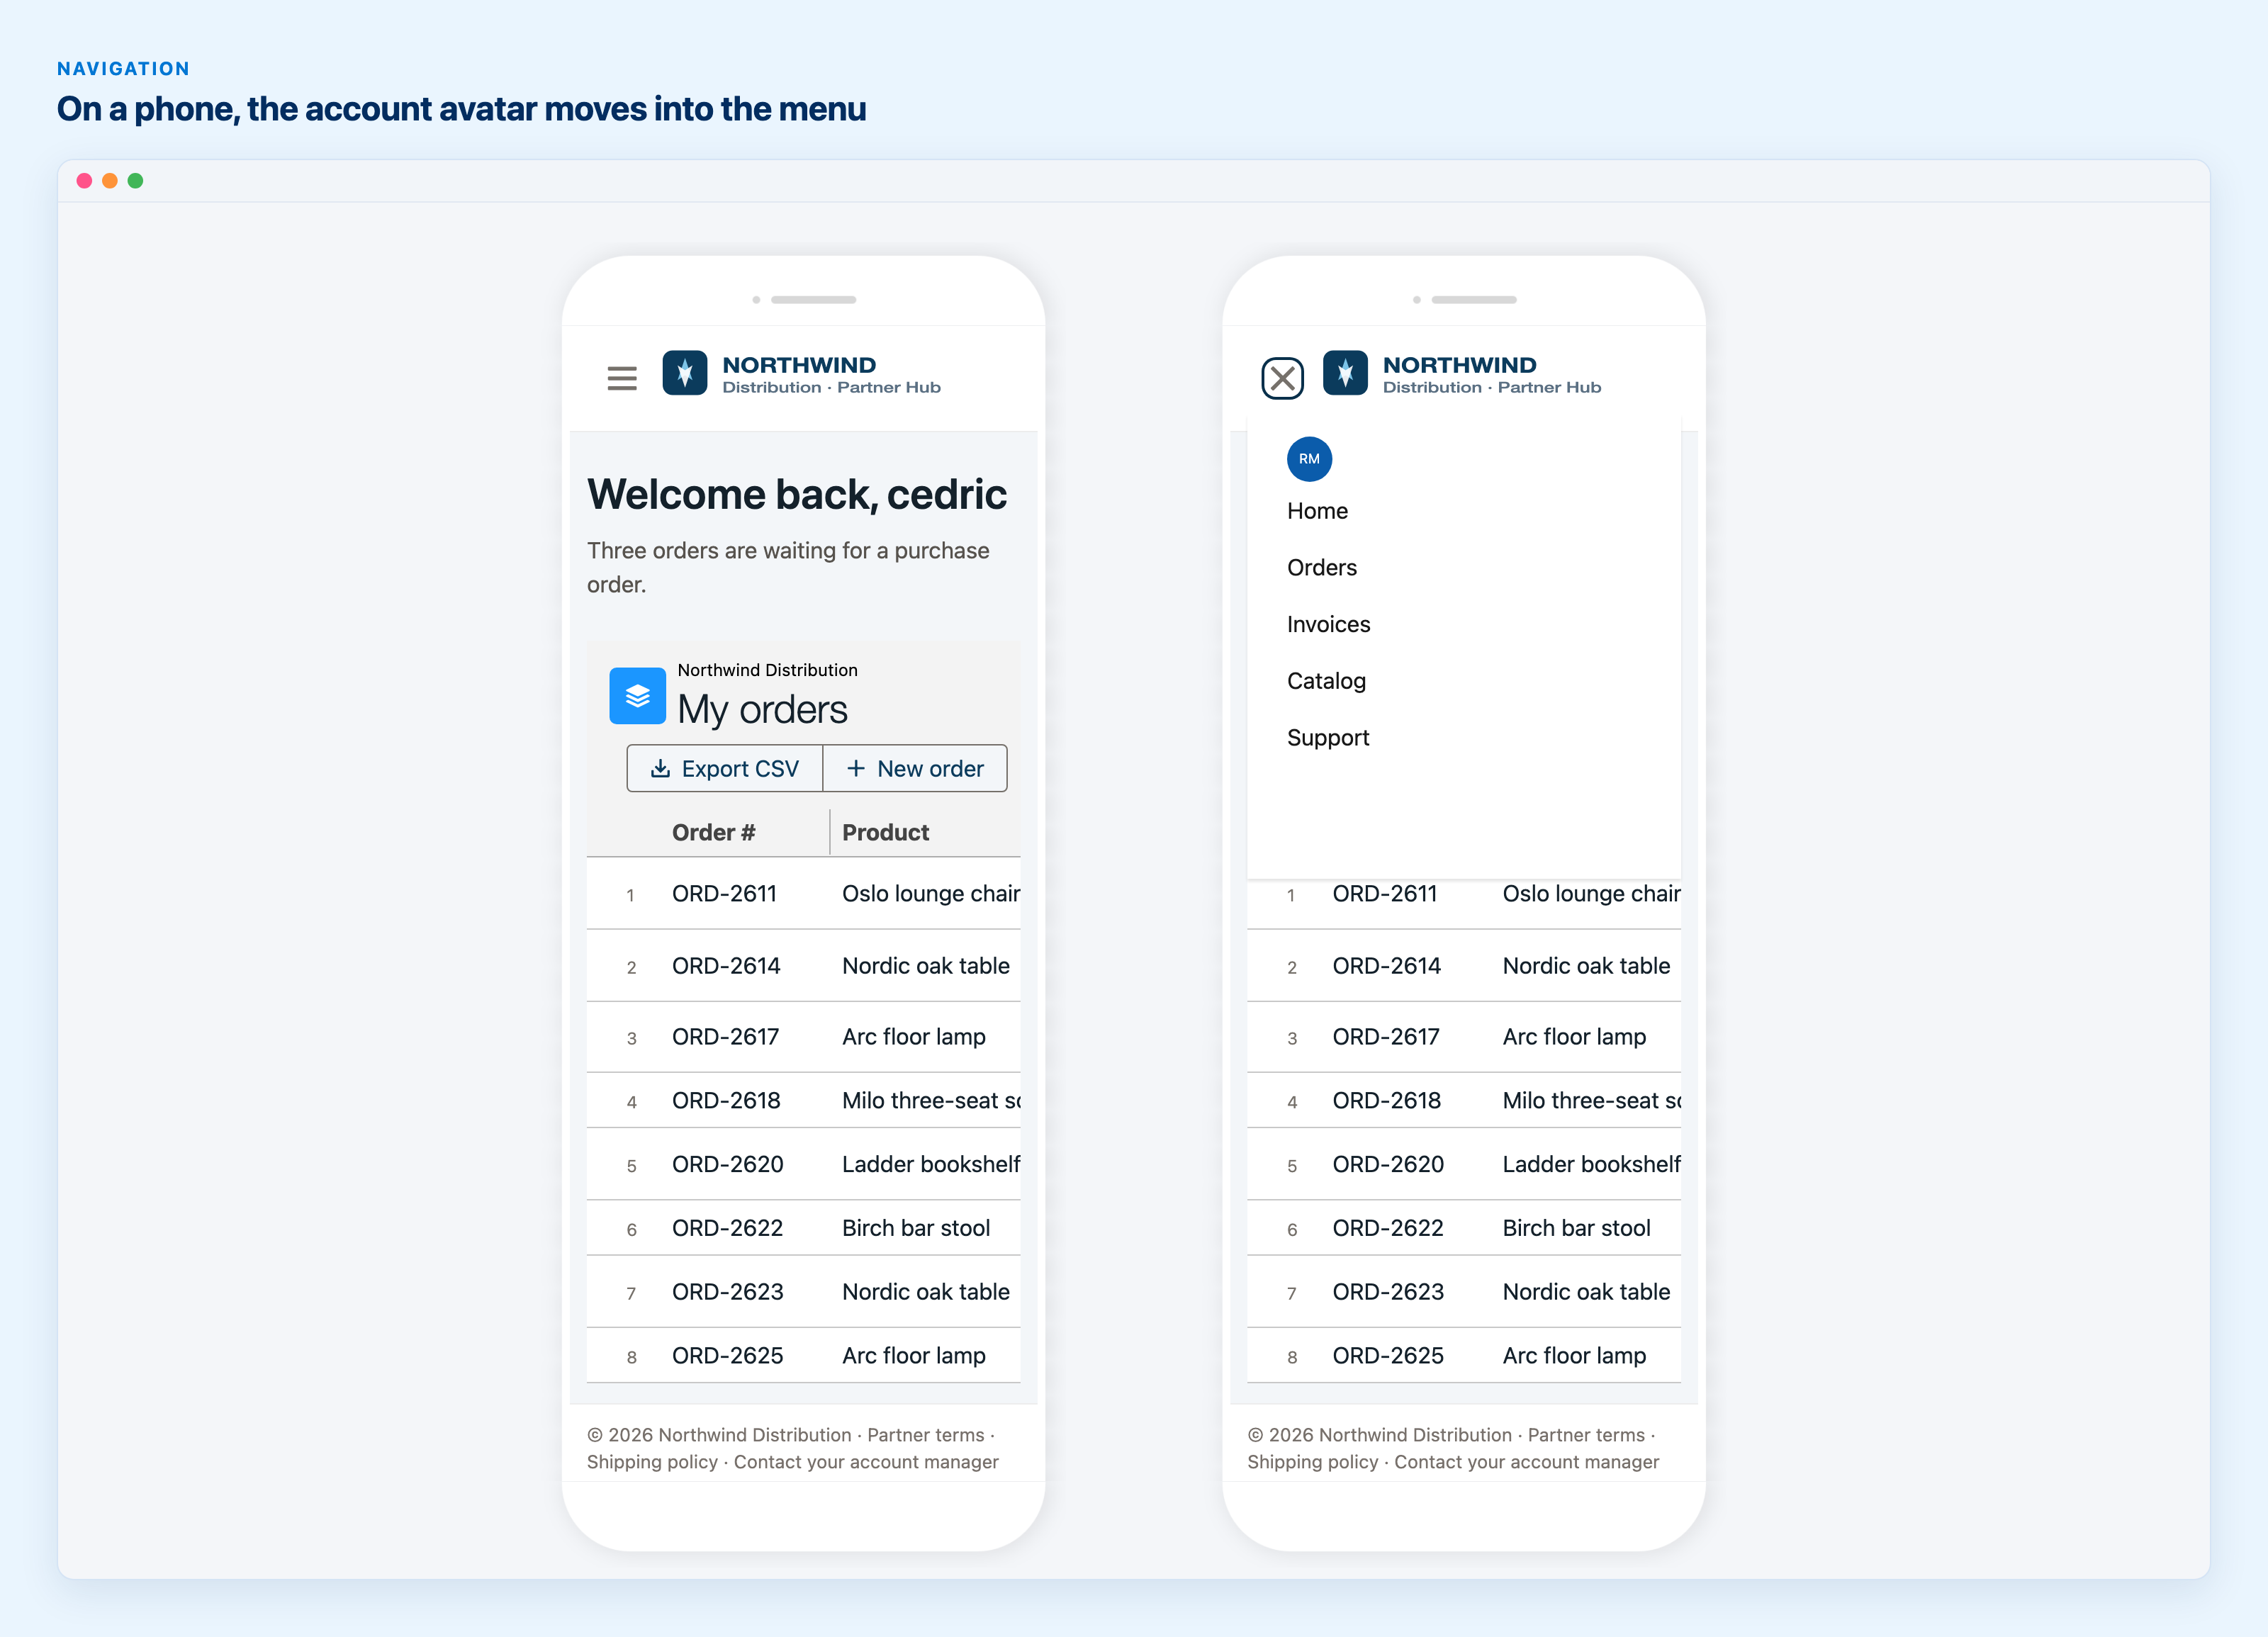
A partner portal in Experience Builder's phone preview: the account avatar leaves the header and appears inside the navigation menu.
The Application Shell theme layout gets a phone mode too. On a phone or tablet its left panel hides and opens as a drawer from a toggle in the header. AX - Navigation documentation
Smaller things worth knowing
A user on page 3 of a Data Table selects two rows, clicks Refresh, and lands back on page 1 with nothing selected. The Refresh Query and Refresh All Queries interactions now have an Override Refresh Behavior option, with Stay on Current Page and Preserve Selected Items, for the Data Table, the List and the Timeline. Both are off by default, so nothing changes until you turn them on.
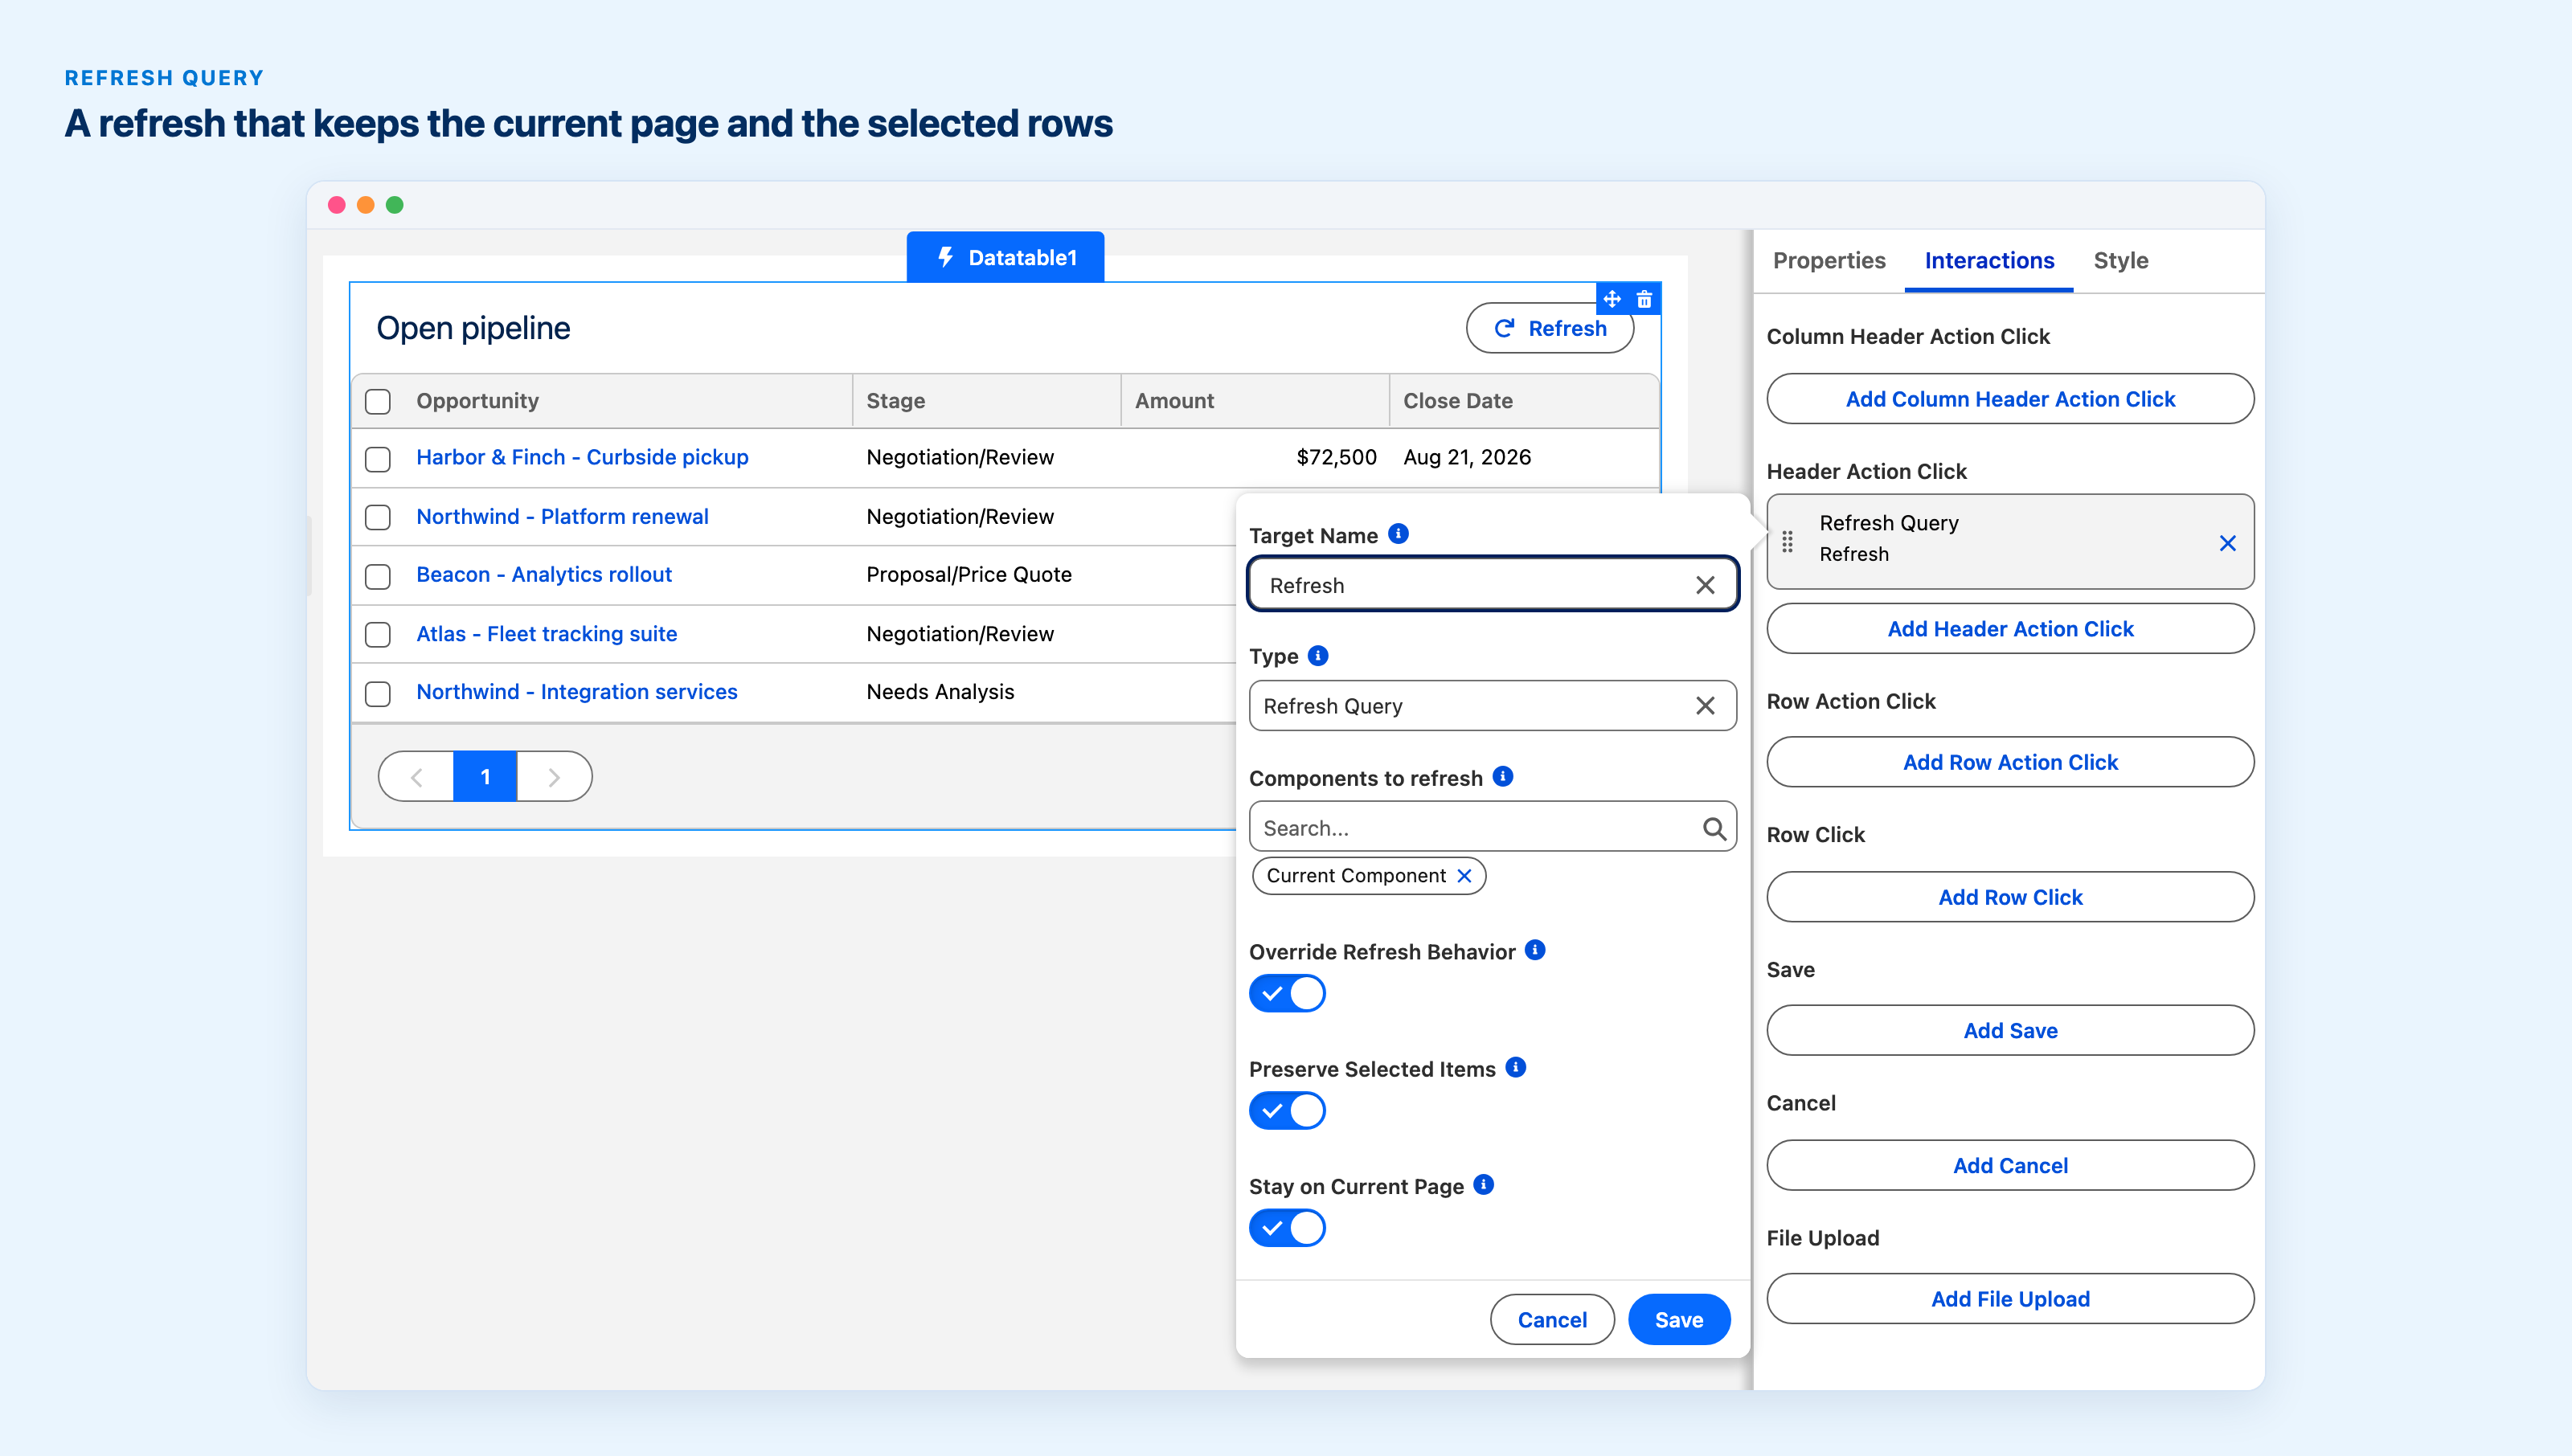
A Refresh Query interaction with Override Refresh Behavior, Preserve Selected Items and Stay on Current Page turned on. All three are off by default.
File Upload in Dynamic Components can now be used by guest visitors on a public Experience Cloud page. Two new properties, Guest File Field Name and Guest File Field Value, tag each uploaded file through a field instead of the record Id, which is the route Salesforce supports for guests. The File Upload documentation walks through the org-side setup.
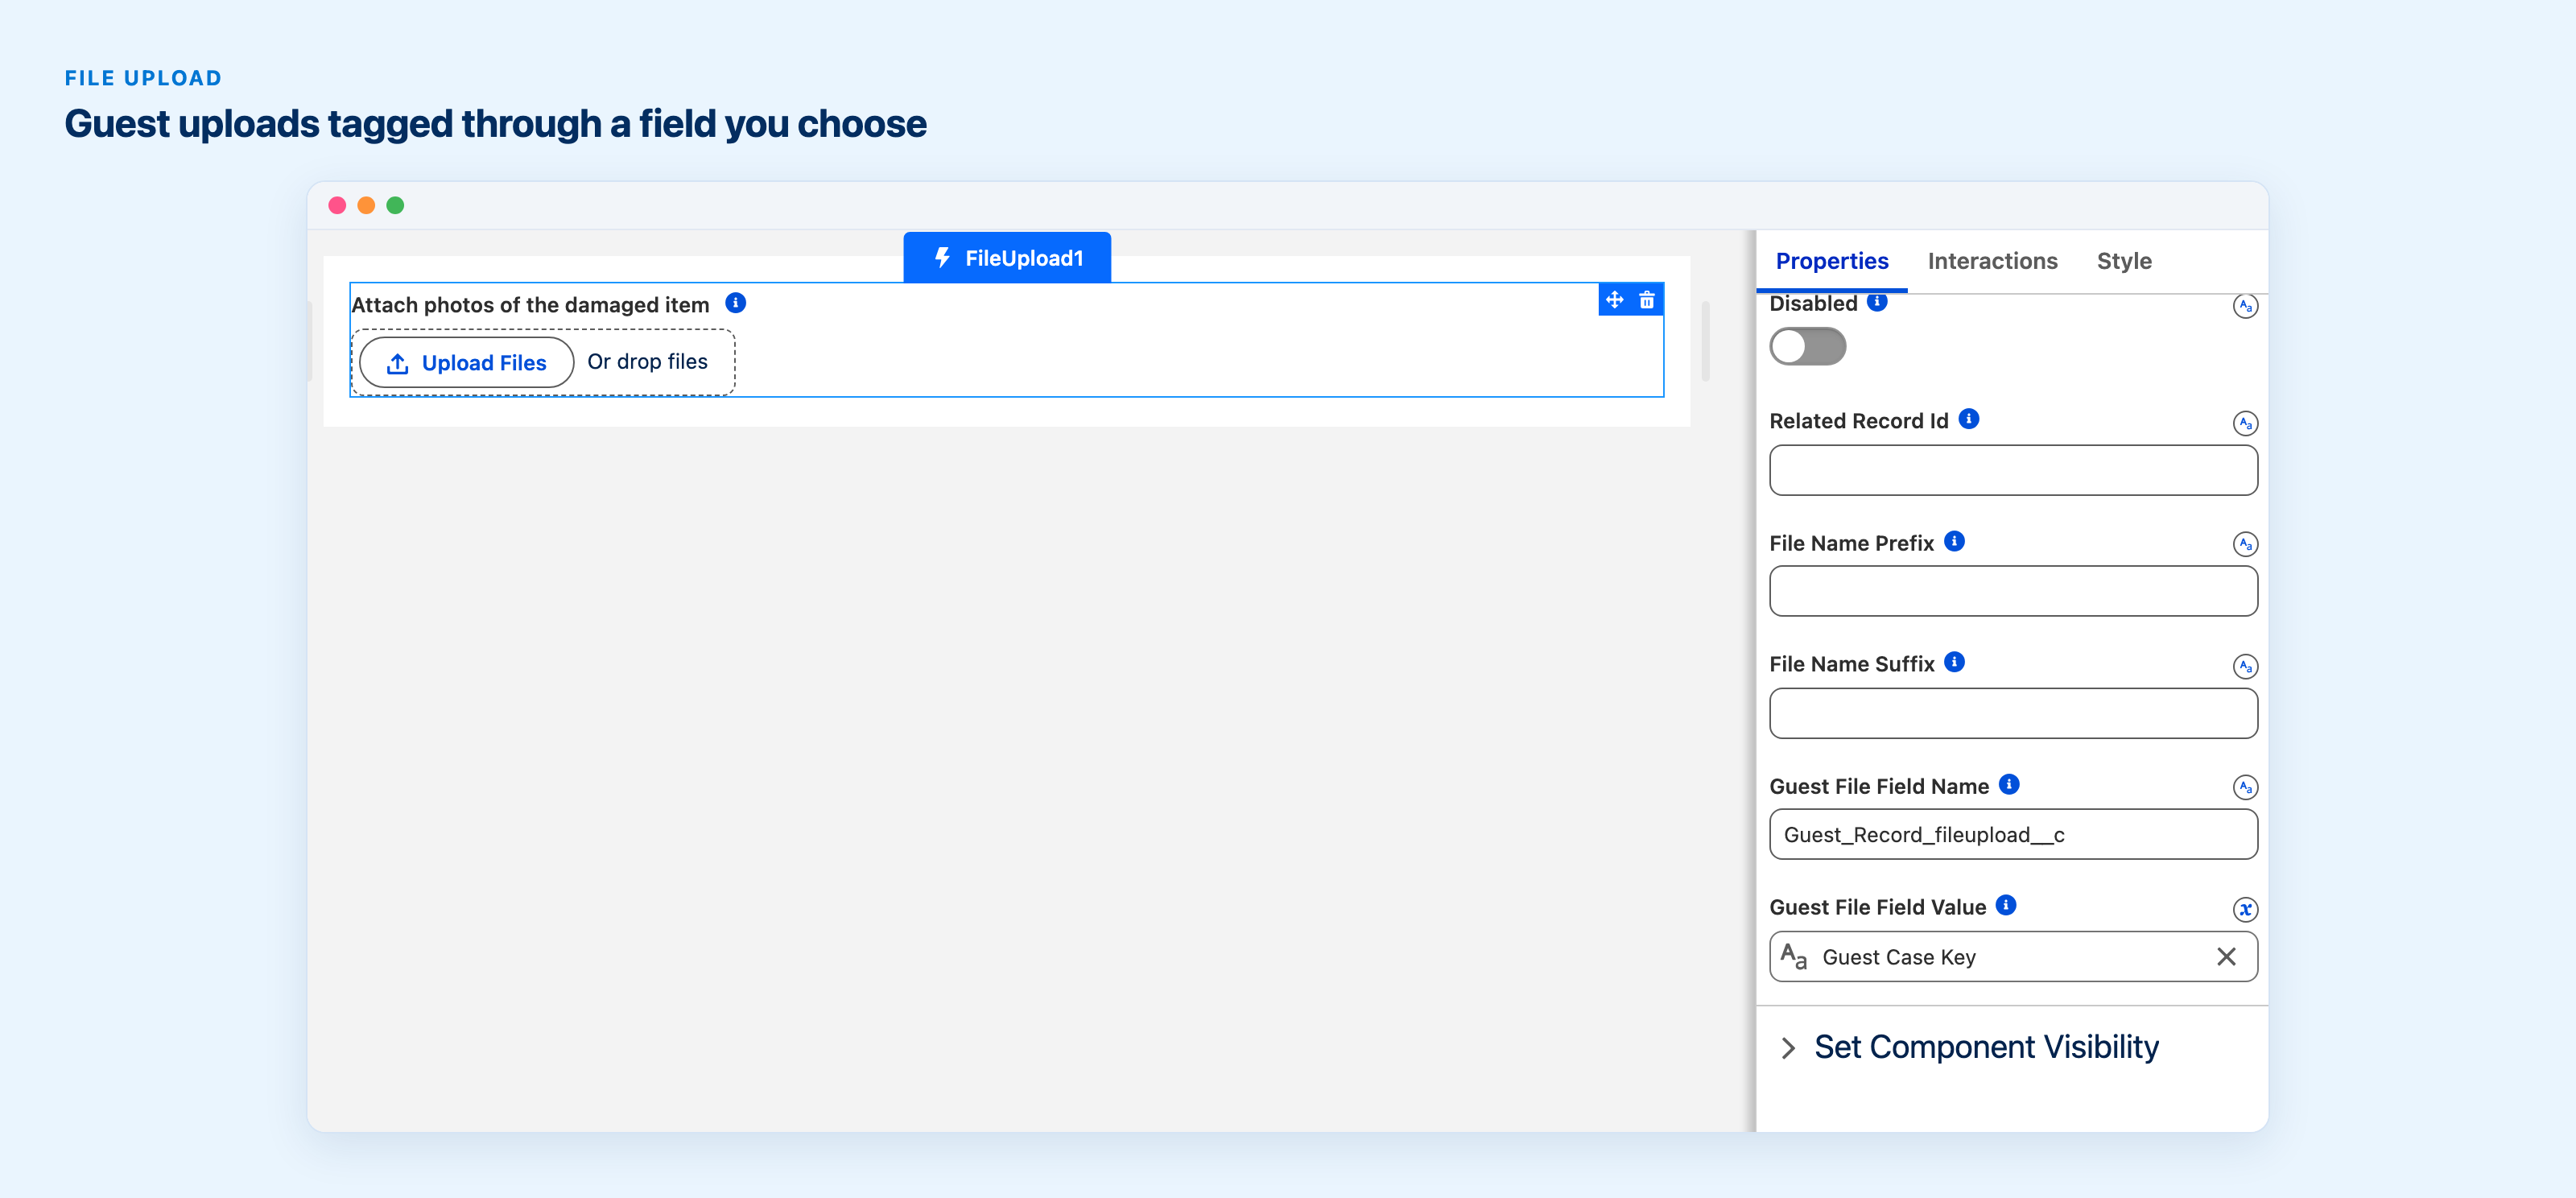
In the Builder, Guest File Field Name and Guest File Field Value tag each upload through a field instead of the record Id.
Chart legends can follow the order you choose. List the category labels in Item Order and the legend reads that way; labels you leave out follow in their usual order. Donut segments can also print their category name next to the value and percentage (Dynamic and Flow).
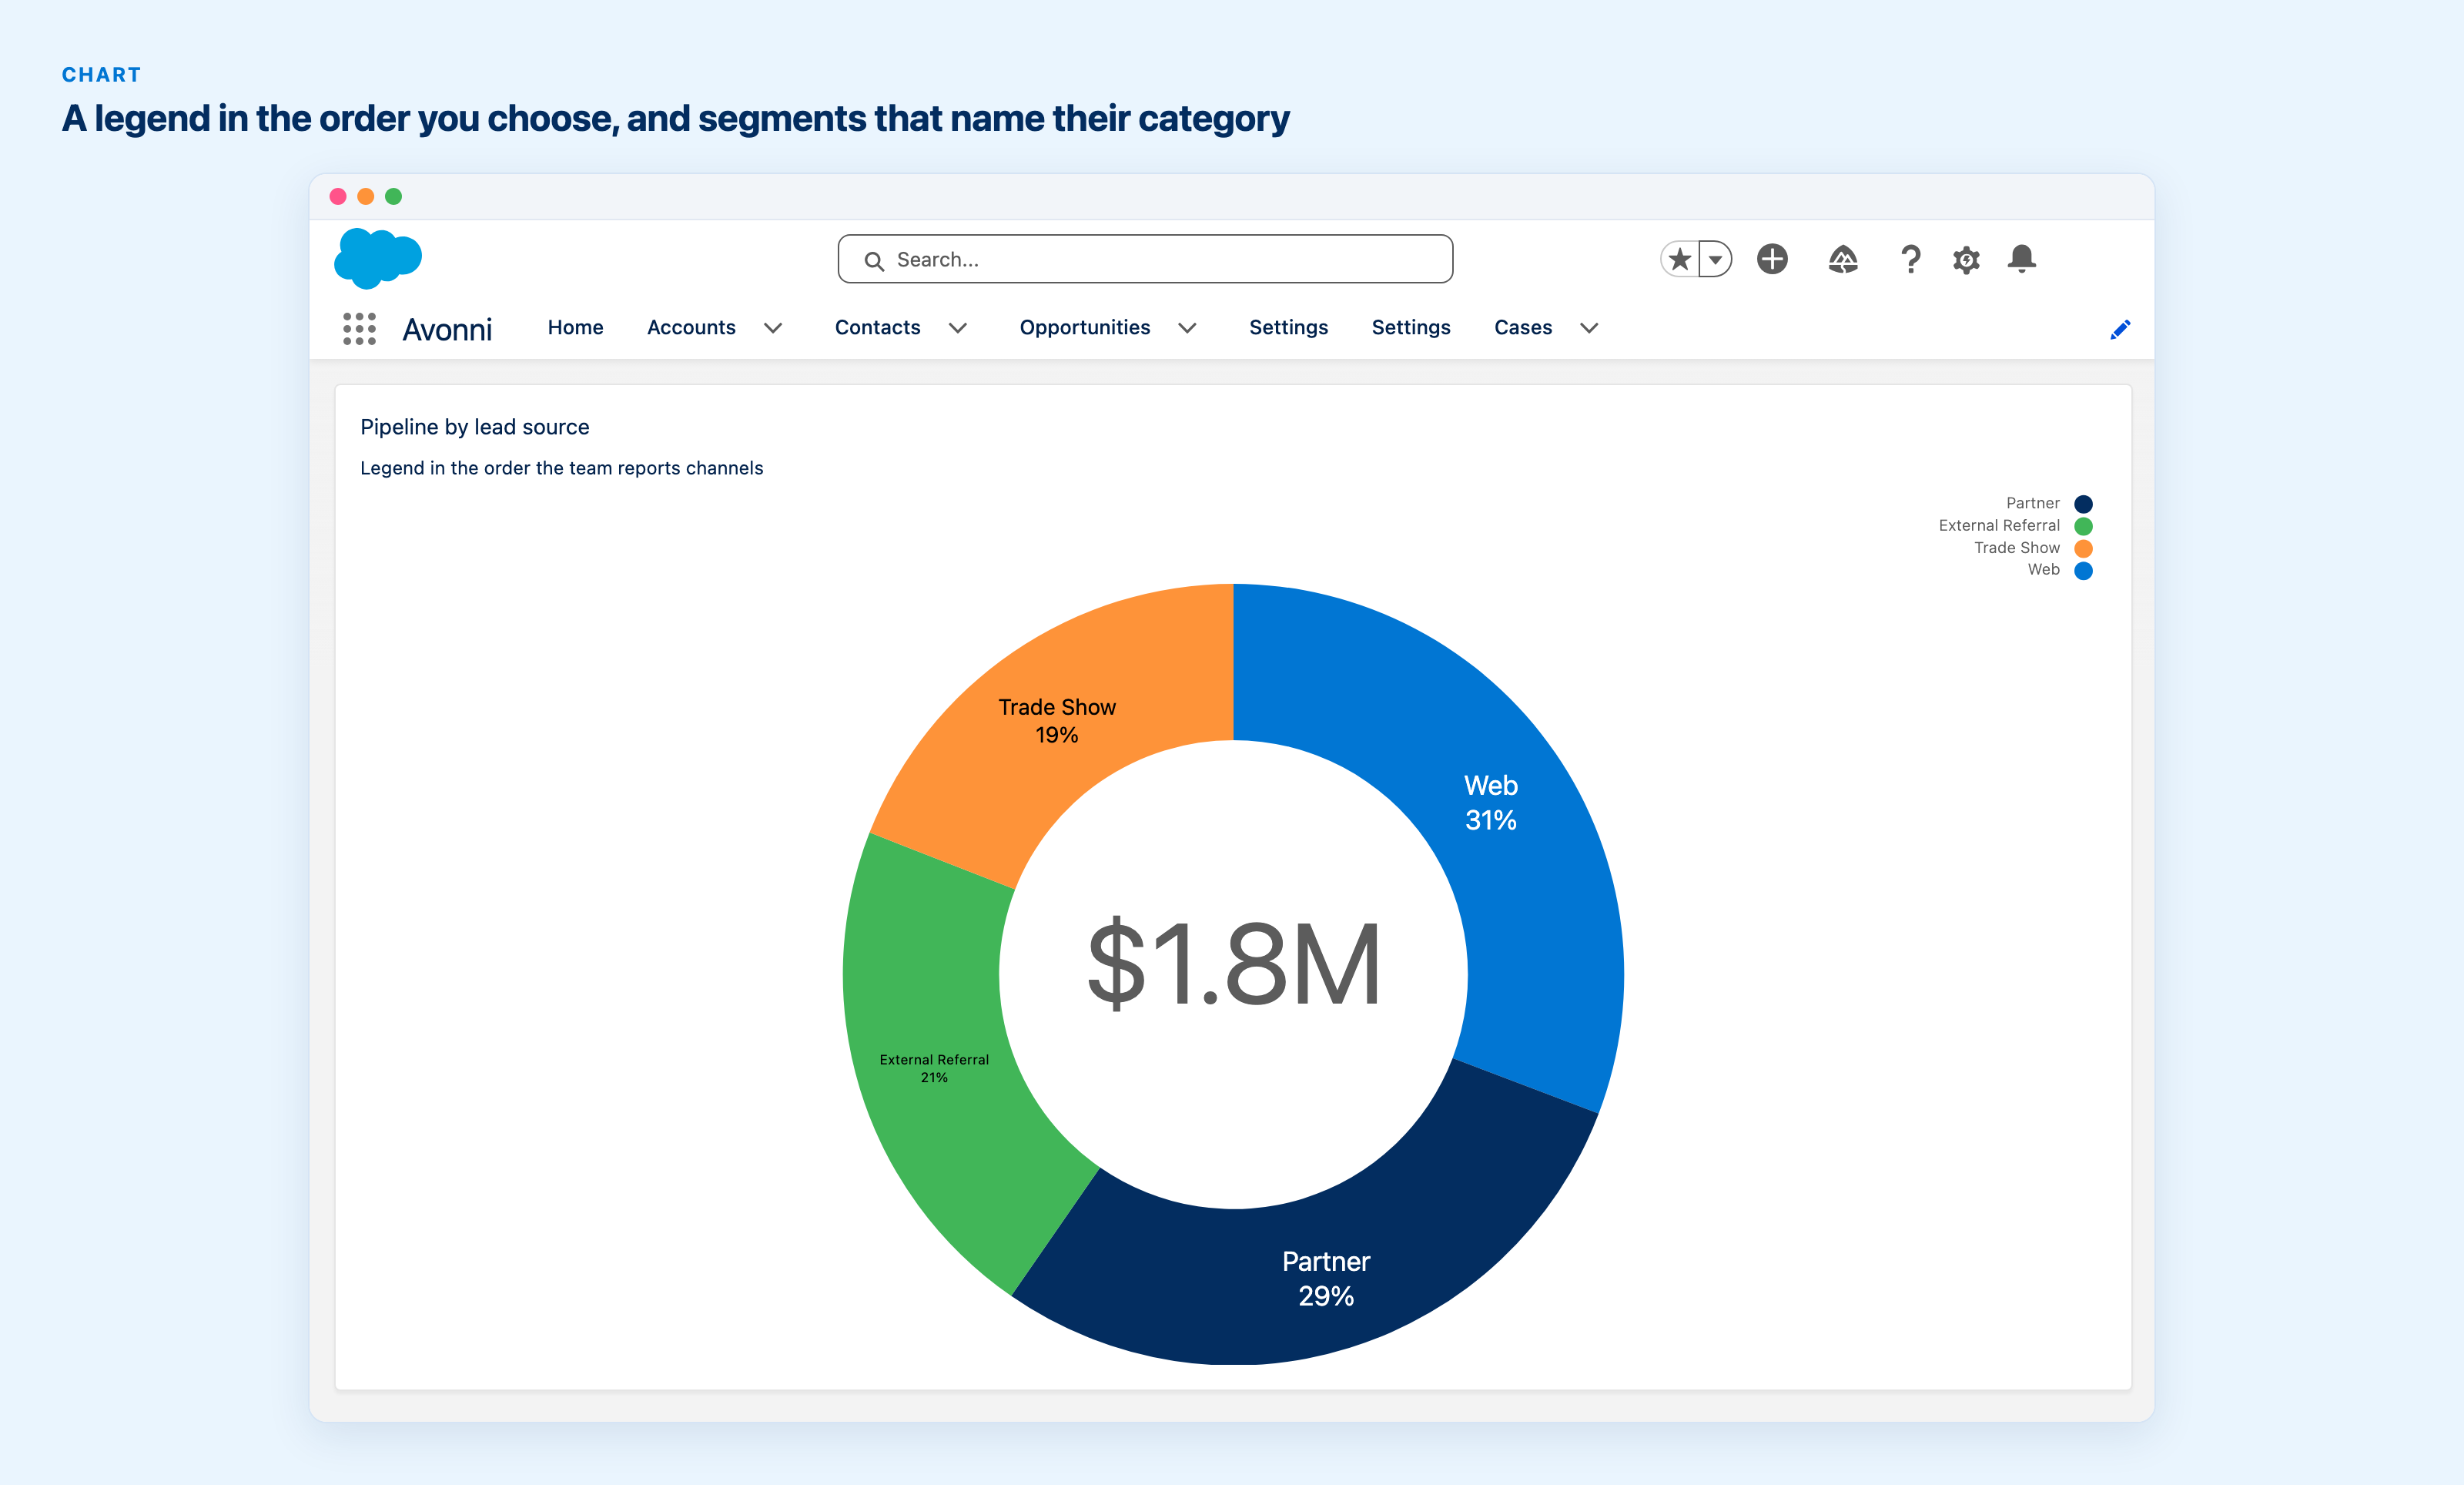
Pipeline by lead source. The legend follows the order set in Item Order, while the segments stay largest first and each one shows its category name and percentage.
- Record Detail sections can carry help text beside their label, the way Salesforce's own dialogs do. The Expandable Section takes help text too.
- The Record Detail Custom Layout dialog has undo and redo, from the toolbar or with Ctrl or Cmd+Z (Dynamic and Experience).
- Dates in the Scheduler and Calendar follow the user's locale instead of a fixed US format. A custom header pattern stays exactly as you wrote it.
- Menus, popovers, the combobox and the color picker flip to the other side when there is no room.
- Open Quick Action reaches global actions, and its picker separates object and global actions.
- Pills have an error state, and Preview stays available while a component saves.
Before you upgrade
- Queries run as the viewing user. In LWC, Dynamic and Experience Components, component queries now use the user's own object, field and sharing access, and the browser can no longer ask for system mode. Flow screen components keep their Query System Mode setting, which works as configured. No query can read a custom setting.
- LWC Components 1.11.x and earlier can now upgrade straight to 1.14.0. The install over 1.11.x used to be refused.
- Donut and funnel segments are always drawn largest first, and Reverse Item Order reverses the legend only.
- The Button Icon Popover now opens to the right by default.
Fixes
Large Data Tables with avatar or progress bar columns show their first rows far faster, and Excel export works again when a column has an empty label. In dark mode, charts take their text, axis and legend colors from the theme, and a funnel measured by a count of records draws its bands again. The Scheduler no longer replaces a real resource with an Empty row. The rest, across the Filter Menu, the Component Builder, the CSV Parser and more, is in the release notes.
Get the update
Every install link and the complete list of changes are in the release notes. Direct installs for production: Experience Components 1.30 (recommended, which includes Dynamic Components), Flow Components 6.35 and LWC Components 1.14. If you still run the older standalone Dynamic Components package, its update is here: Dynamic Components 1.57 (standalone). As always, install in a sandbox first.