0:00 Welcome
Welcome to a new Avonni video tutorial! Today, you'll get started with Avonni Dynamic Components. You'll build your own Lightning component, with a live total, a table you can edit, and an action button, and you'll put it on a record page. No code, start to finish. Let's go!
0:20 What is a Dynamic Component
So, what is a Dynamic Component? It's a Lightning component that you build in a visual editor, the Component Builder, instead of writing code. You drag elements onto a canvas, like a card, a metric or a data table. You connect them to your Salesforce data with a query. And you decide what happens on each click or save. Then you place it on any Lightning page, like a standard component. For your users, that means fewer clicks, fewer tabs, and everything they need in one place. For you, it means fewer tickets for your developers.
0:55 Dynamic Components and the standard page
Salesforce record pages are already very good. You get related lists, report charts, and Dynamic Forms to place fields and sections, with visibility rules. A roll-up summary field can even store an account's pipeline. What the standard page can't do is put a live total, an editable table, and an action button in one card that work together. Until now, that meant a custom Lightning web component, written by a developer. That's the gap Dynamic Components fill.
1:23 Dynamic Components or Screen Flow
Now, you may ask: why not a screen flow? Both are no-code, and they don't do the same job. A Dynamic Component lives on the page. It's always there, it shows dense information, and your users act on the spot. A screen flow is a guided process. It has steps, a start and an end, and logic between the screens. And they work together. A button in a Dynamic Component can open a screen flow in a dialog, with the Open Flow Dialog interaction. So use the component for the page, and the flow for the process.
2:00 In an Experience Cloud site
One more thing. Dynamic Components also work in Experience Cloud sites. In Experience Builder, you drag the AX Dynamic Component and pick your component, on Aura and LWR sites. Same component, same builder, now in front of your customers or partners. The same package also gives you more than forty Avonni Experience Components, like a data table, a map or a banner, that you place one by one in Experience Builder. Use them to lay out a page. Use a Dynamic Component when several elements must share data and logic.
2:35 Our example
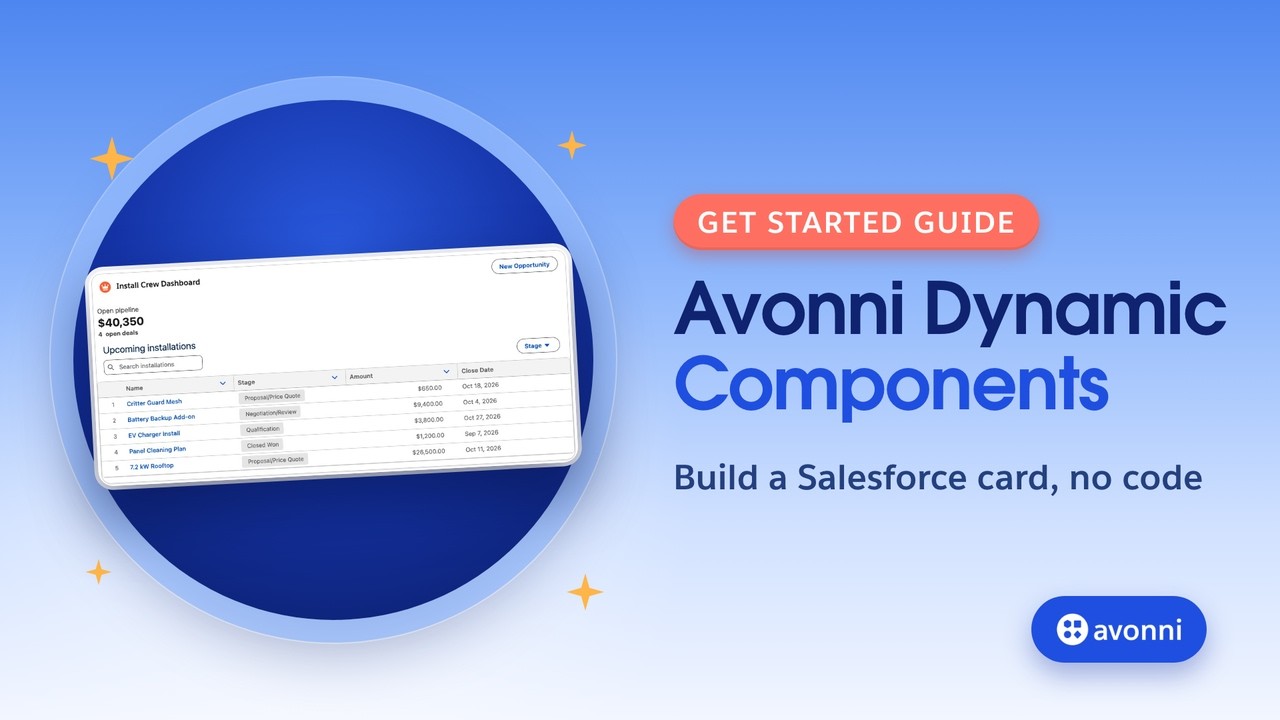
To learn it, let's take a real use case. SolarOps installs residential solar panels. Maya Chen coordinates the installations. Every morning, she opens a customer's account, like Ferreira Residence, and she wants three things in one place: the value of the open pipeline, the list of opportunities, and a way to fix an amount without leaving the page. Here's what we'll build: one card, on the account page.
3:02 The plan
Here's the plan. A card, to hold everything. A query, for the account's opportunities. A metric, for the open pipeline. A data table, with inline editing, search and filters. A save that updates the total. And a button to create an opportunity. Then we put it on the account page.
3:23 What you need
Before we start, you need three things. The Avonni Experience Components package, which includes Dynamic Components. The Avonni Experiences Admin permission set, to build components. And an account with a few opportunities.
3:38 Tour of the Component Builder
Open the App Launcher, and the Avonni Experiences app. In the Dynamic Components tab, click New Component. You can start from a template, but today, we start from a blank component. This is the Component Builder. On the left, five panels. Elements: every component you can drag, by category. Resources: your queries, variables and formulas. Interactions: everything that happens on load or on a click, in one list. Styles: your saved styles. And Structure: the tree of your component. In the middle, the canvas. On the right, the settings of the selected element, in three tabs: Properties, Interactions and Style. And at the top: Preview, Save, and Activate.
4:31 The card and the Target Page Object
Let's build. Drag a Card onto the canvas. Give it a title, Install Crew Dashboard, and an icon. The card will hold everything else. Now save. The first save asks for a label, and one setting that matters: the Target Page Object. Choose Account. This tells the component it lives on an account page, and it gives you the ID of the record on screen. That's how the component knows which account it's on. No code, no variable to connect.
5:03 The query
Now the data. In Resources, create a new resource of type Query. Name it, and choose Opportunity. Add a condition: Account ID equals the record ID of the page. Switch the value to Mapped, open $Component, and pick RecordId. That's your data source, without Apex and without writing SOQL.
5:26 The metric
Drag a Metric into the card. Label it Open pipeline. For the value, switch to Query: Opportunity, field Amount, function Sum, and treat blank values as zero. The metric runs its own aggregate query, so it gets its own filters: Account ID equals RecordId, and Closed equals false. Format it as currency, in US dollars, with no decimals. Then a secondary value, the same way, with Count: the number of open deals, shown under the total. A KPI, with no report and no formula field.
6:05 The data table
Now the star of the show. Drag a Data Table under the metric. Set the data source to Query, and pick the query we created. Add the columns. The name, with Linkify, so each row opens its opportunity. The stage, as a badge. The amount, editable. And the close date, editable too. Give the table a title, turn on search on the name, add a filter on the stage, and let every column sort. A related list can't do that in one place: here, Maya searches, filters and edits, right on the page.
6:40 Saving the changes
When Maya edits a cell, a Save button appears. Open the Interactions tab of the table. Under Save, there's already an interaction: Update Record(s). It writes your edits to Salesforce, and it shows a confirmation. You don't need anything else to save. But there's a catch. The metric has its own query, and it doesn't know the amount changed. So under On Success, add Refresh All Queries. After each save, every query of the component runs again, and the total follows.
7:16 The button
Last element. Drag a Button into the card's actions, and label it New Opportunity. In its Interactions tab, add a Click interaction: Navigate, to the Opportunity object page, action New. And prefill the Account ID with the record ID. The new opportunity is already linked to the right account.
7:37 Preview, then activate
Before you activate, preview it. With no record, there's nothing to show. Open Debug Details, pick an account, like Ferreira Residence, and you see the real data: thirty-eight thousand six hundred fifty dollars of open pipeline, four open deals, and five opportunities. It looks right. Save, and activate. A component that isn't active doesn't show up on your pages.
8:02 On the account page
Now, the last step. Open an account, and Edit Page. In the Custom Managed components, drag AX Dynamic Component onto the page, and pick Install Crew Dashboard. There's nothing to connect: the component already knows it's on an account. Save, and activate the page.
8:22 Test it
Let's test it. First, a mistake. Maya types minus five hundred as the amount of 7.2 kW Rooftop, and saves. Our validation rule says no. The row is flagged, and the message says why: Amount must be greater than zero. Nothing was saved. Now the real value: twenty-six thousand five hundred. Save. It's saved, and the open pipeline goes from thirty-eight thousand six hundred fifty to forty thousand three hundred fifty dollars, without leaving the page. And the opportunity really says twenty-six thousand five hundred in Salesforce. It works!
9:00 Pro tips
Five pro tips. One: set the Target Page Object at your first save, and filter your queries on RecordId. Two: preview with a real record in Debug Details, because the builder alone has no page behind it. Three: after a save, add Refresh All Queries, or your totals keep the old numbers. Four: the table's Save already writes the records and shows a message, so don't add a second toast. And five: rename your elements with clear API names, like PipelineMetric, instead of Metric1. You'll thank yourself when the component grows.
9:40 Recap
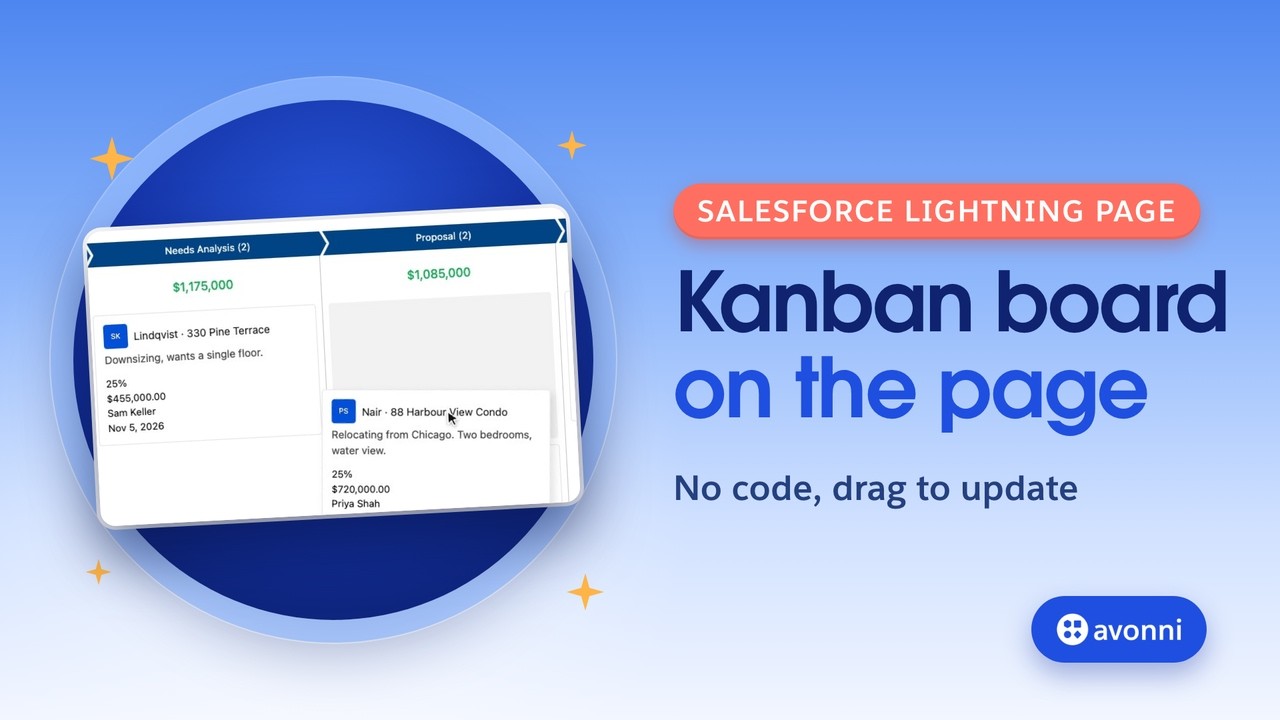
To recap. A Dynamic Component is your own Lightning component, built without code. We made a card with a live total, an editable table and a button, on one query filtered by the page record. The table's save writes to Salesforce, and Refresh All Queries keeps the total true. Maya gets her pipeline where she already works. Next, build a Kanban board the same way: the link is on screen. Thanks for watching, and see you in the next Avonni tutorial!