0:00 Fix the number behind the total
Watch: I open this total, correct the deal behind it, and save. The monthly figure and the grand total update, right here on the Salesforce page. Hi, I'm Cédric from Avonni. In this tutorial, we'll build an editable pivot table on a Lightning app page, without using a report as its data source.
0:22 A month-end view for Sales Ops
Priya runs Sales Ops at Northwind Distribution. She needs closed sales by month and region for Monday's review. One deal, Halden Robotics, was entered at eighty-four thousand instead of forty-eight thousand. She wants to investigate the total and fix the record in one place. This belongs on an app page: we're working across opportunities, with no current record and no guided steps to complete.
0:48 Start with the standard Salesforce report
A Salesforce matrix report already handles the analysis. Group Close Date by calendar month, put Region across the columns, filter to Closed Won and the first half of twenty twenty-six, and sum Amount. You can drill into its summary values, too. Keep this option for reporting. Our goal is to bring the working grid and the amount correction onto the app page itself.
1:14 Build the Pivot Table in Dynamic Component Builder
You'll need Avonni Experience Components for the builder and components, the Avonni Experiences Admin permission set to configure them, and a Region field on Opportunity to group the sales; the installation links are in the description. The current package includes ten free production licenses. Here is the Avonni collection in Lightning App Builder. For this grid, we'll create a Dynamic Component in the Component Builder, then place it on our page. With Avonni Dynamic Components, you can build a reusable piece of a Lightning page without writing code. A screen flow would make sense if Priya needed to enter a correction and send it for approval. For her Monday review, she just needs to open a total, fix the deal, and keep working in the same grid. Add a Pivot Table and create an Opportunity query. Set Stage to Closed Won to summarize completed sales. We'll choose the reporting period with the date filter on the page. For rows, choose Close Date and Year-Month. That keeps each month under its own year. Turn on full month labels so the review is easy to read. For columns, choose our Opportunity Region field. For the measure, choose Amount and Sum, and label it Closed Won, in dollars. Now each intersection answers a simple question: how much did this region close in this month? Name the table Closed Won by month and region. Enable subtotals and the grand total: the year subtotal rolls up the month rows, and the column totals let us compare regions. Turn on Detail Rows to inspect the records behind a cell. Then enable inline editing so we can correct Amount in those details. Changes stay in draft until we click Save.
3:07 Make the filters part of the workflow
Add Stage, Close Date, Region, Owner, and Product Line as user filters. We'll explicitly select the status and period on the page before opening details, so the summary and the records we're editing use the same scope. Enable Use Cascading Filter Values. After choosing a region, the owner choices can narrow to people with matching deals. Set the empty message to No closed deals match these filters. That tells Priya what happened when a combination returns nothing.
3:42 Add the component to a Lightning app page
Save and activate the component. In Lightning App Builder, create an app page called Sales Ops Pulse and choose a single region for a full-width grid. Drag in AX - Dynamic Component and select our component. Check Display as Card to give the table a clear white surface. Save, activate the page, and add it to the Sales app navigation. Choose who can access the page. For this demo, I'm assigning it to the administrator profile. In your org, give the intended users the appropriate package access and record permissions as well.
4:22 Filter, investigate, and save the Opportunity
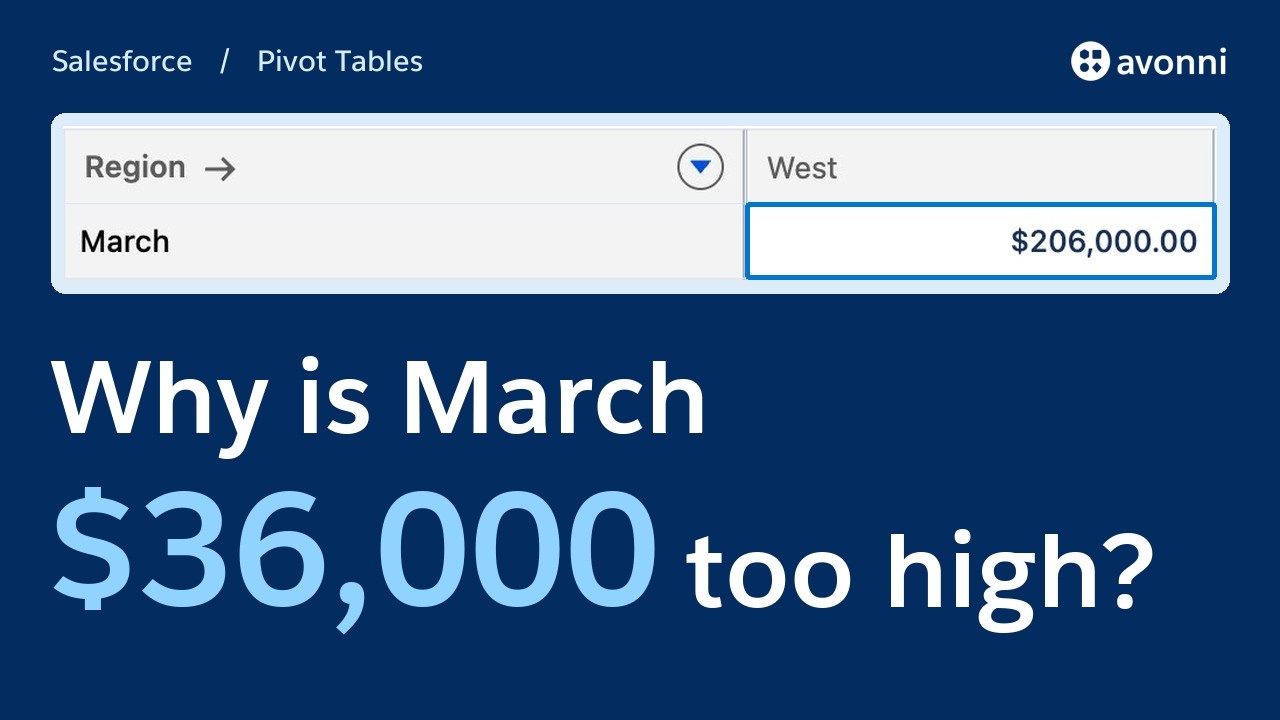
On the page, select Closed Won and the January-to-June date range. Check the selected filter labels before working with the numbers. Choose Canada, then open Owner. Priya is the matching owner here. That's the cascade in action. Clear the region selection while keeping our status and period. March in the West shows two hundred and six thousand across three deals. Open the cell. Here's Halden Robotics. Change Amount from eighty-four thousand to forty-eight thousand, then click Save. March drops to one hundred and seventy thousand. The West total and the grand total fall by the same thirty-six thousand. Open the opportunity itself: the saved amount is forty-eight thousand. We changed the Salesforce record, not just the display. For an empty-state check, filter Region to Empty. No deals match, and our message appears. Remove that filter to return to the review.
5:24 Build with Claude Code, Avonni Agent Skills and MCP
We’ve built Priya’s grid by hand. What if another admin had to build it from her request? Let’s try that in Claude Code. I’ll ask for closed-won sales by month and region, with the deals behind each total. The Avonni skill guides the build. The MCP server gives Claude the actual Pivot Table settings. Before generating anything, I check the plan. Close Date needs both the year and the month, and the amount is a sum. Now for the same test we used in the Builder. Open March, West. Can Priya find the Halden deal behind that number?
6:12 When to use each option
Use a matrix report for reporting features such as formulas and subscriptions. Reports support inline editing in some cases, but Opportunity Amount is specifically excluded. Report Chart embeds a chart, rather than the matrix grid. Dashboards are useful for multiple views and filters, with their own refresh behavior. Choose this Pivot Table when the job is to inspect a total and correct its underlying amounts from the same app page.
6:41 Two useful finishing touches
If your data spans years, don't group by Month alone: January from different years can land together. Use Year-Month when the year matters. Add a second measure: count the opportunity IDs and call it Deals. Turn on Stacked Summaries to show the count alongside the amount in each cell. That helps distinguish one large deal from several smaller ones.
7:07 Recap
We built the grid in the Component Builder, placed it on an app page, and made the status and period explicit. Priya can now move from a monthly total to a saved correction without leaving her review.
7:20 Next step
Next, watch five Data Table tricks for a Salesforce record page. You'll see how to work with individual records using filters, bulk edits, and actions, when your next task needs a detailed list rather than monthly totals.