Take Your Salesforce User Experience to the Next Level. Create Salesforce Apps 10x faster. - 70+ Flow Screen Components - 40+ Experience Cloud Components - Free up to 10 users
Avonni Components passed Salesforce's security review and is listed on the AppExchange
Take Your Salesforce User Experience to the Next Level. Create Salesforce Apps 10x faster. - 60+ Flow Screen Components - 30+ Experience Cloud Components - Free up to 10 users
Avonni Components passed Salesforce's security review and is on the AppExchange
Spring '26 brought inline editing to the standard Flow Data Table, and people got genuinely excited about it. This is a feature admins and architects have been asking for since the component launched in Winter '23. It's a real step forward.
Here at Avonni, we've been building data table components for Screen Flows for several years now. We've spent a lot of time understanding what admins and users actually need from a table inside a flow — and we've learned that inline editing is just one piece of a much larger puzzle.
So here's an honest look at where both components stand today — so you can decide what fits your needs. If you already know Avonni is what you're after, you can install directly from the AppExchange. Otherwise, read on.
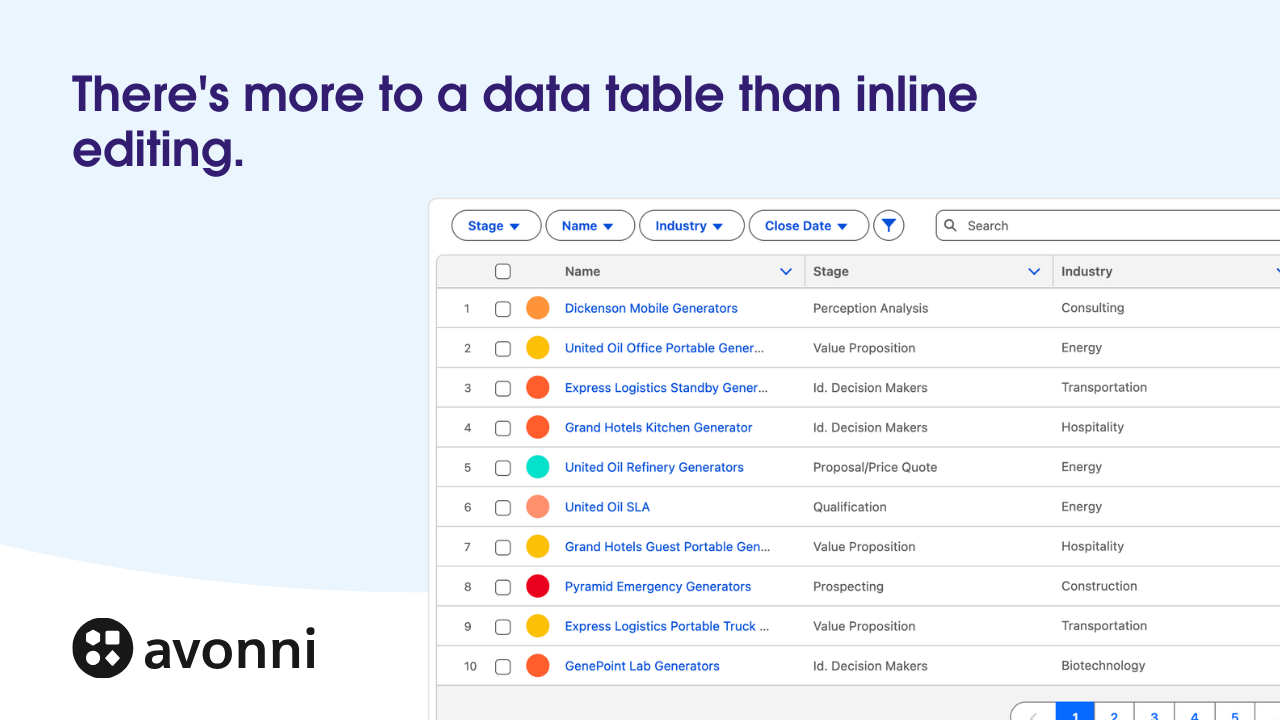
Standard Salesforce Data Table
Avonni Data Table - Same Records, difference experience.
Getting data into the table
With the standard Data Table, you build a Get Records element, pull a collection, and pass it to the component. It's straightforward and works well for basic use cases.
The Avonni Data Table gives you another option: a built-in query data source with a visual query builder. You configure which records to display right inside the component — no separate Get Records needed. This also unlocks server-side filtering, which matters because it actually performs better on large datasets compared to filtering only on the client side.
Then there's how lookup fields show up. The standard component displays the raw record ID. To show the related record's name, you typically need formula fields, which work but add maintenance. Avonni traverses lookup relationships natively, showing names without the extra work.
Worth knowing: Avonni's query data source can simplify your flow canvas — fewer elements, fewer variables to manage.
What users see in each column
This is where the two components really start to differ.
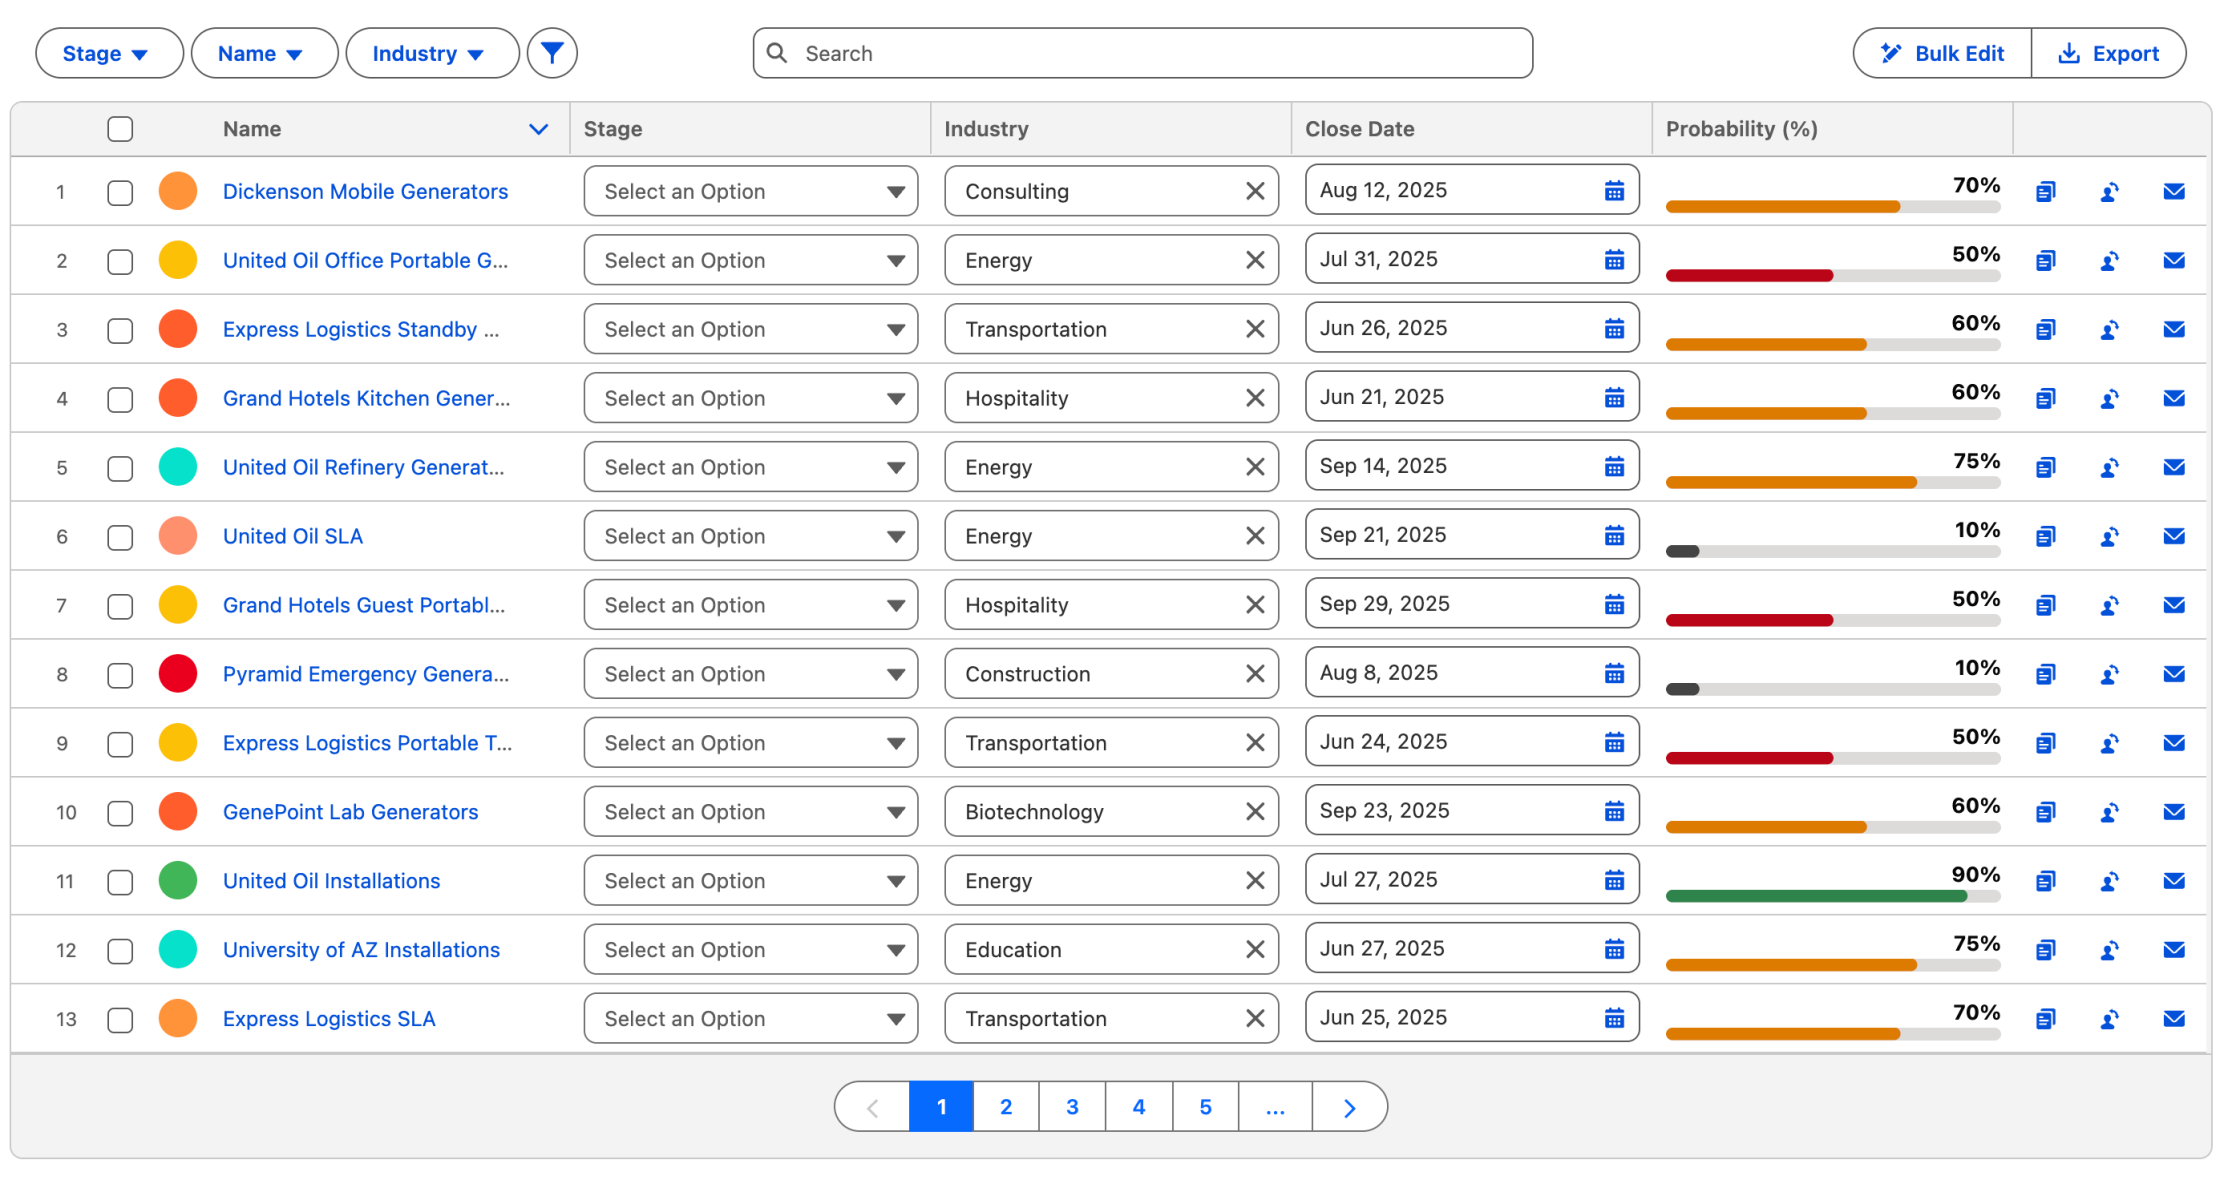
The standard Data Table renders columns as plain text. It's clean and functional, but every column looks the same whether it's a status, an amount, or a percentage — everything shows as text.
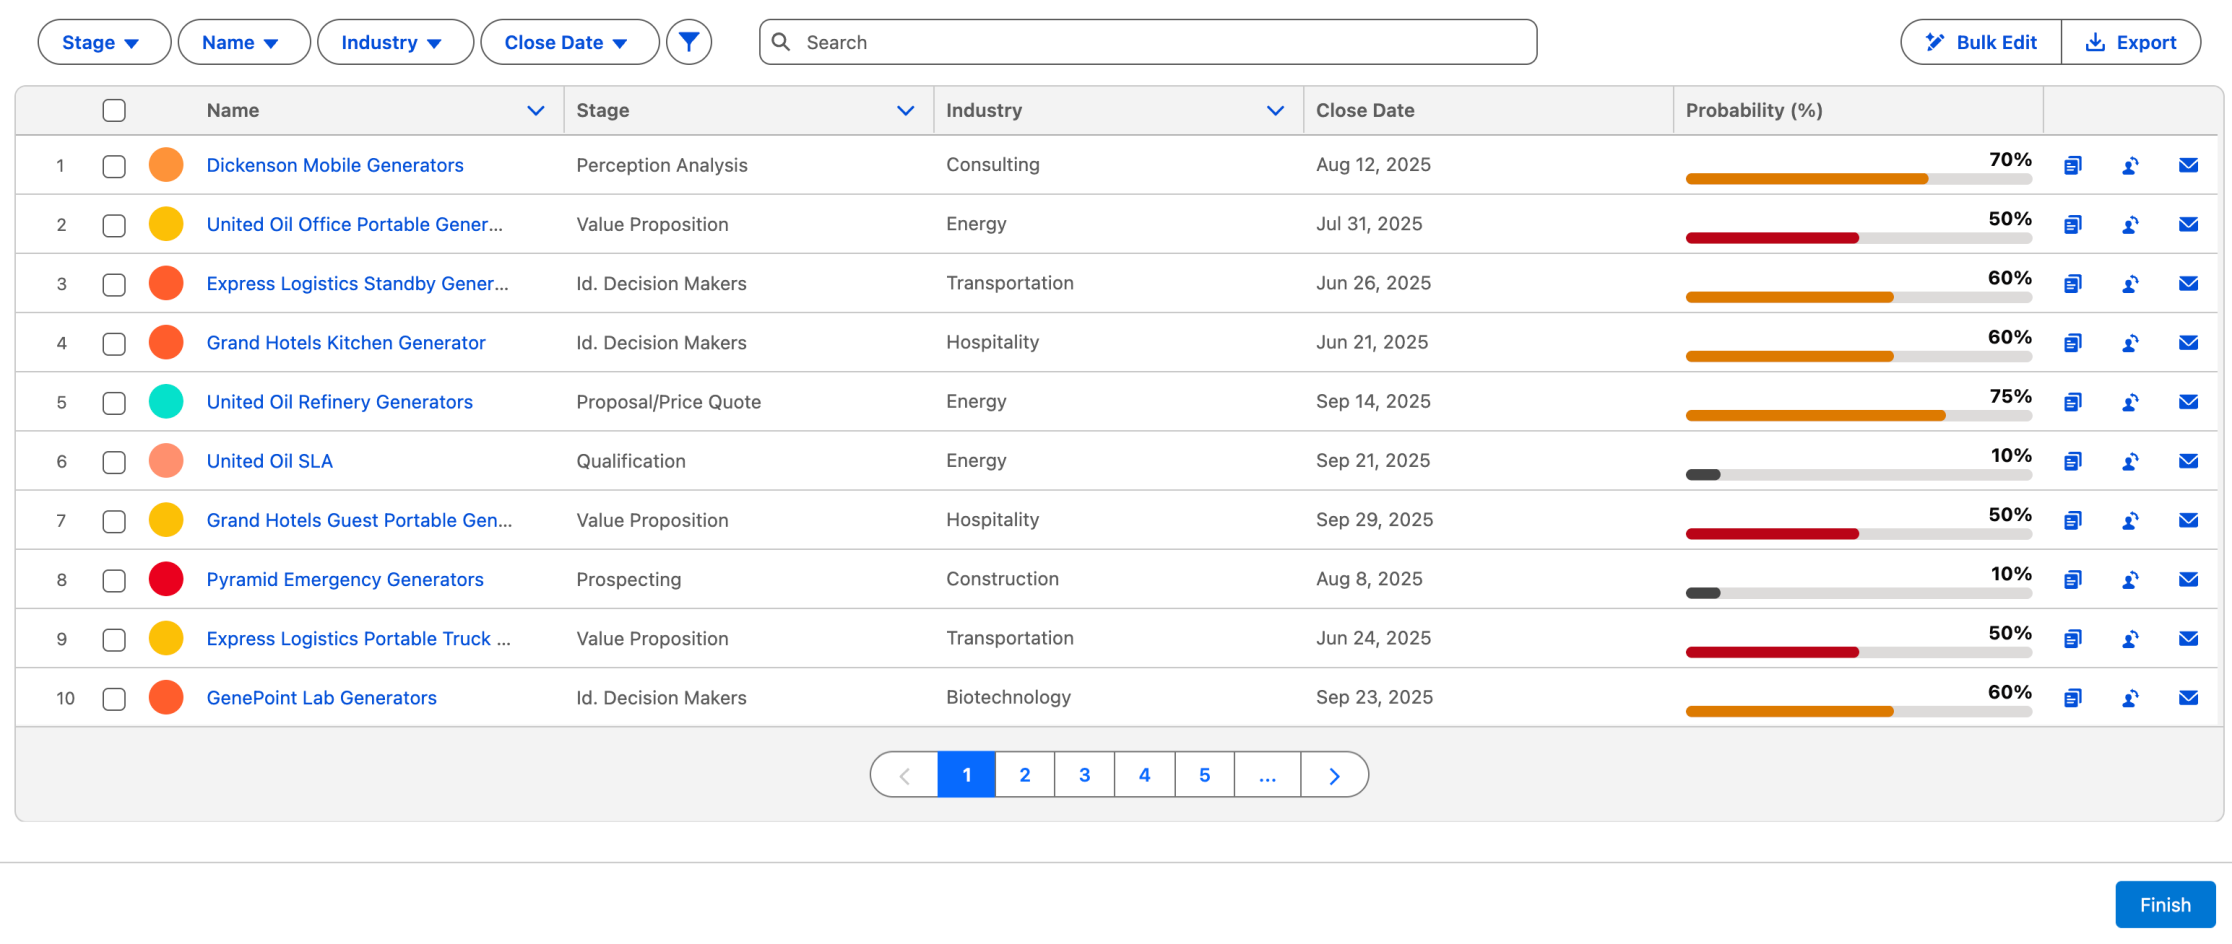
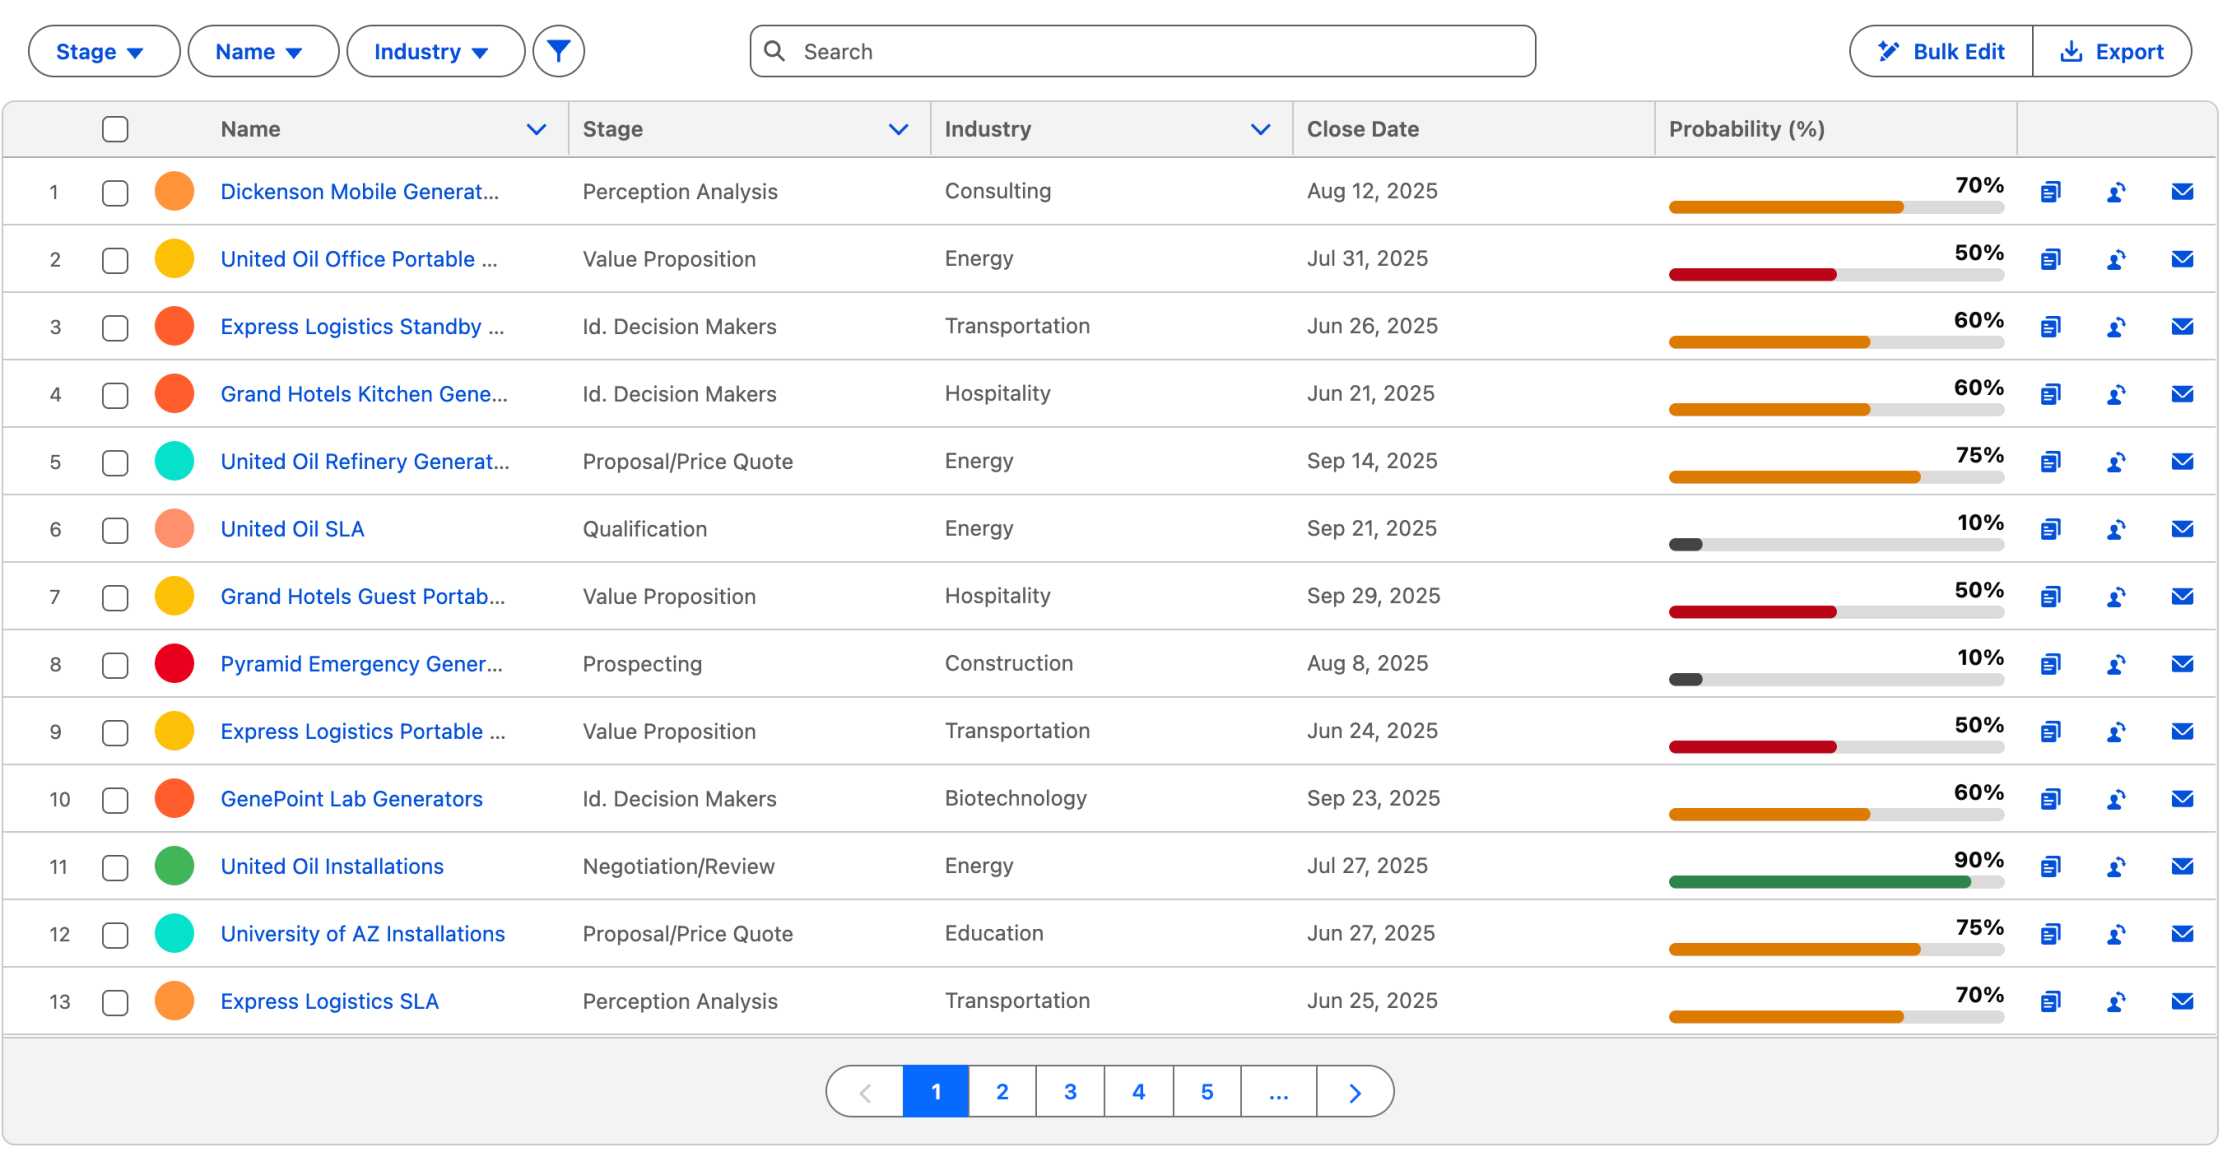
The Avonni Data Table supports over 25 column display types:
Badges
Status fields
Color-coded so priority reads at a glance.
Progress bars
Completion metrics
Visual bars instead of plain percentages.
Avatars
Contact photos
Faces in line with names.
20+ more
Ratings, sliders, QR codes
Plus barcodes, images, and auto-formatted currency.
When users are scanning dozens of records, visual formatting helps them find what matters faster. A color-coded badge communicates priority at a glance in a way that plain text just doesn't.
Avonni also supports conditional cell coloring — changing backgrounds or text color based on data values — which gives admins another way to surface important information visually.
Your users don't read tables - they scan them. Visual Column types let them find what matters most.
Worth knowing: Rich column types help users interpret data faster, especially in tables with many rows.
Inline editing — what Spring '26 brings and what's next
Credit where it's due — Spring '26 is a genuine milestone. After three years as read-only, the standard Data Table now lets users edit records inline. The community waited a long time for this, and it delivers.
Spring '26 covers
Standard Data Table
✓Text, Email, Phone
✓Number, Currency, Percent
✓Checkbox
Avonni adds
Avonni Data Table
✓Date pickers
✓Picklist dropdowns
✓Lookup field editing
✓Per-column required validation
✓Configurable numeric formatting
Is the gap narrower now? Absolutely — and we're genuinely glad to see it. A stronger standard component benefits admins everywhere. But we talk to teams every week whose workflows need date pickers, picklist dropdowns, lookup editing, and field-level validation. Those needs don't wait for the next Salesforce release — and with Avonni, they don't have to.
Spring'26 brought inline editing for text fiels. This is what it looks like with the Avonni Data Table - where every field type is supported
Worth knowing: Spring '26 covers a solid range of field types. For dates, picklists, lookups, and field validation, Avonni fills the gap today — no waiting on the next release. Install the package and you're up and running in minutes.
Search, filtering, and sorting
Both components now support a search bar and column sorting (sorting arrived in Standard with Spring '26). That shared foundation covers a lot of use cases.
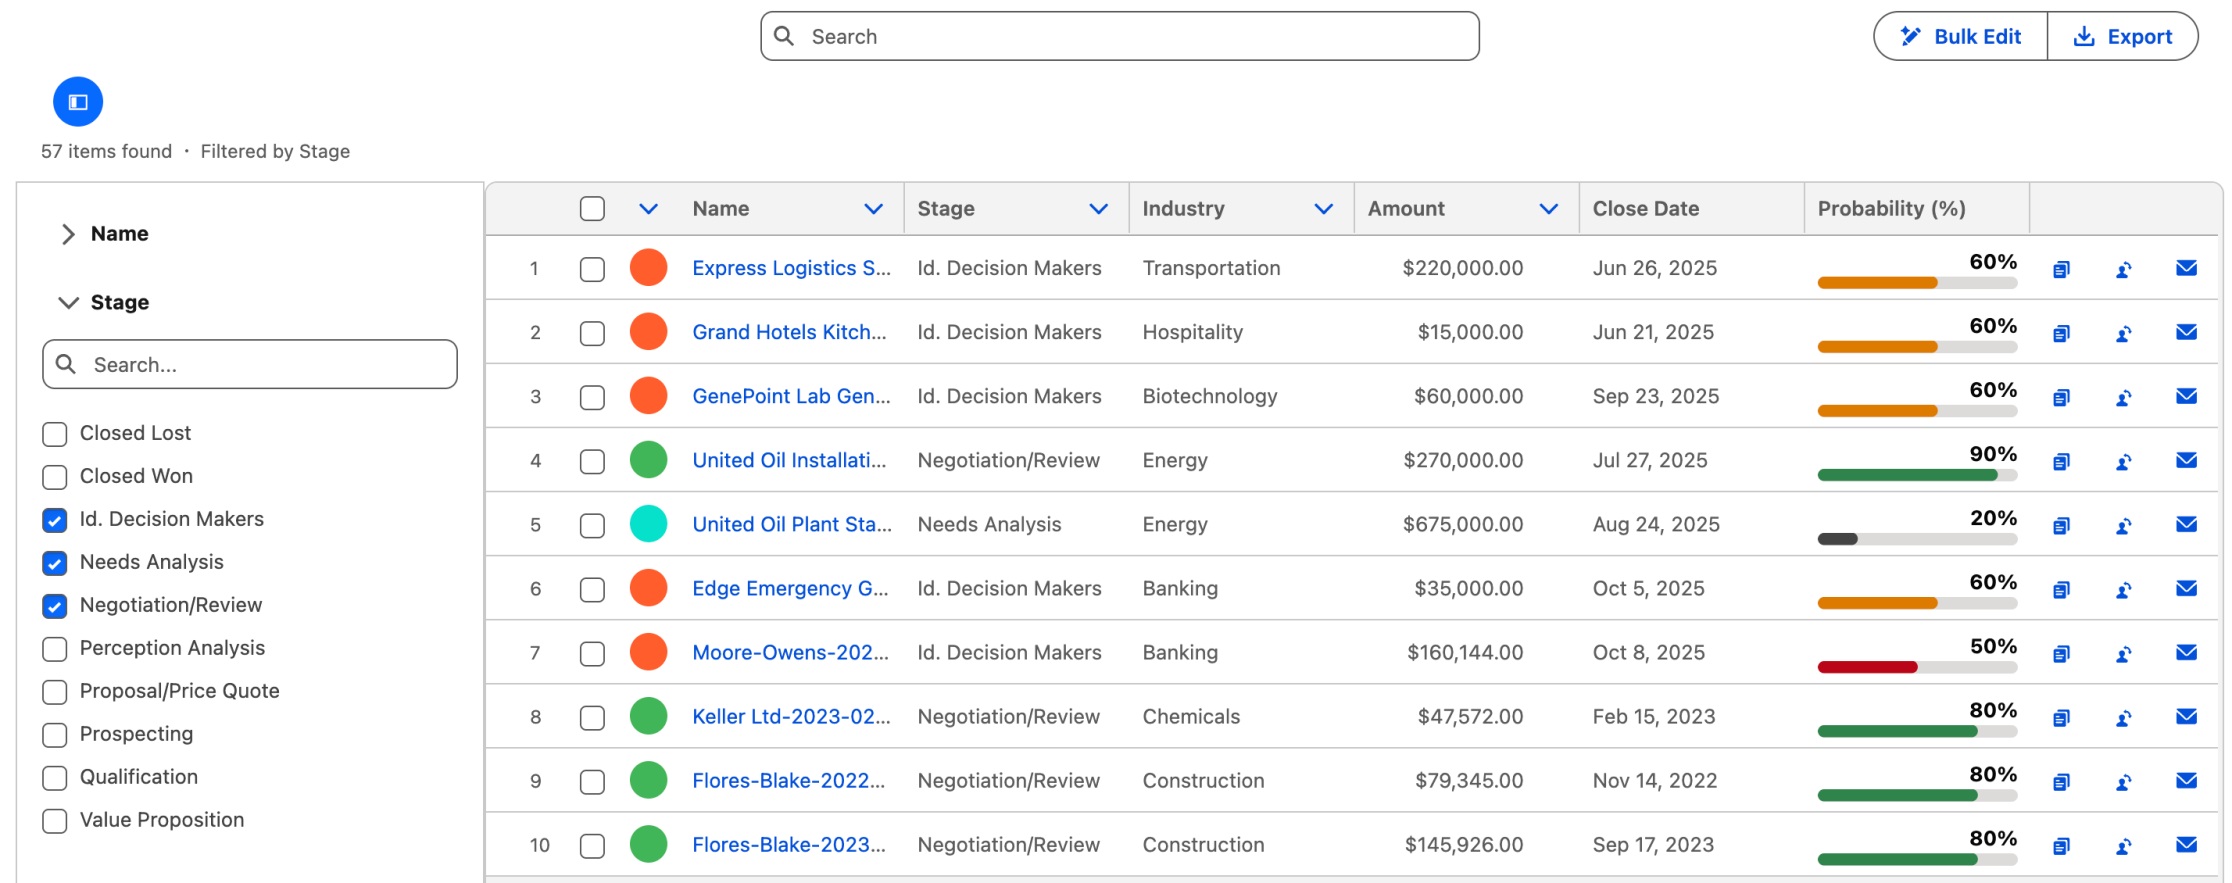
The difference is in field-level filtering.
The standard component offers a global search bar. If your users need to narrow results by a specific field — showing only high-priority cases or filtering by stage — you have to build additional filter components in the flow.
Avonni includes a built-in filter panel where admins select which fields to expose as filter controls. Users can filter by specific columns right in the table. Combined with the query data source, filtering happens server-side, which is important for large datasets.
"Show me only high-priority deals in negociation" One click, not a custom-built filter screen.
Worth knowing: If your users regularly need to slice data by specific fields, built-in filtering saves significant flow-building effort.
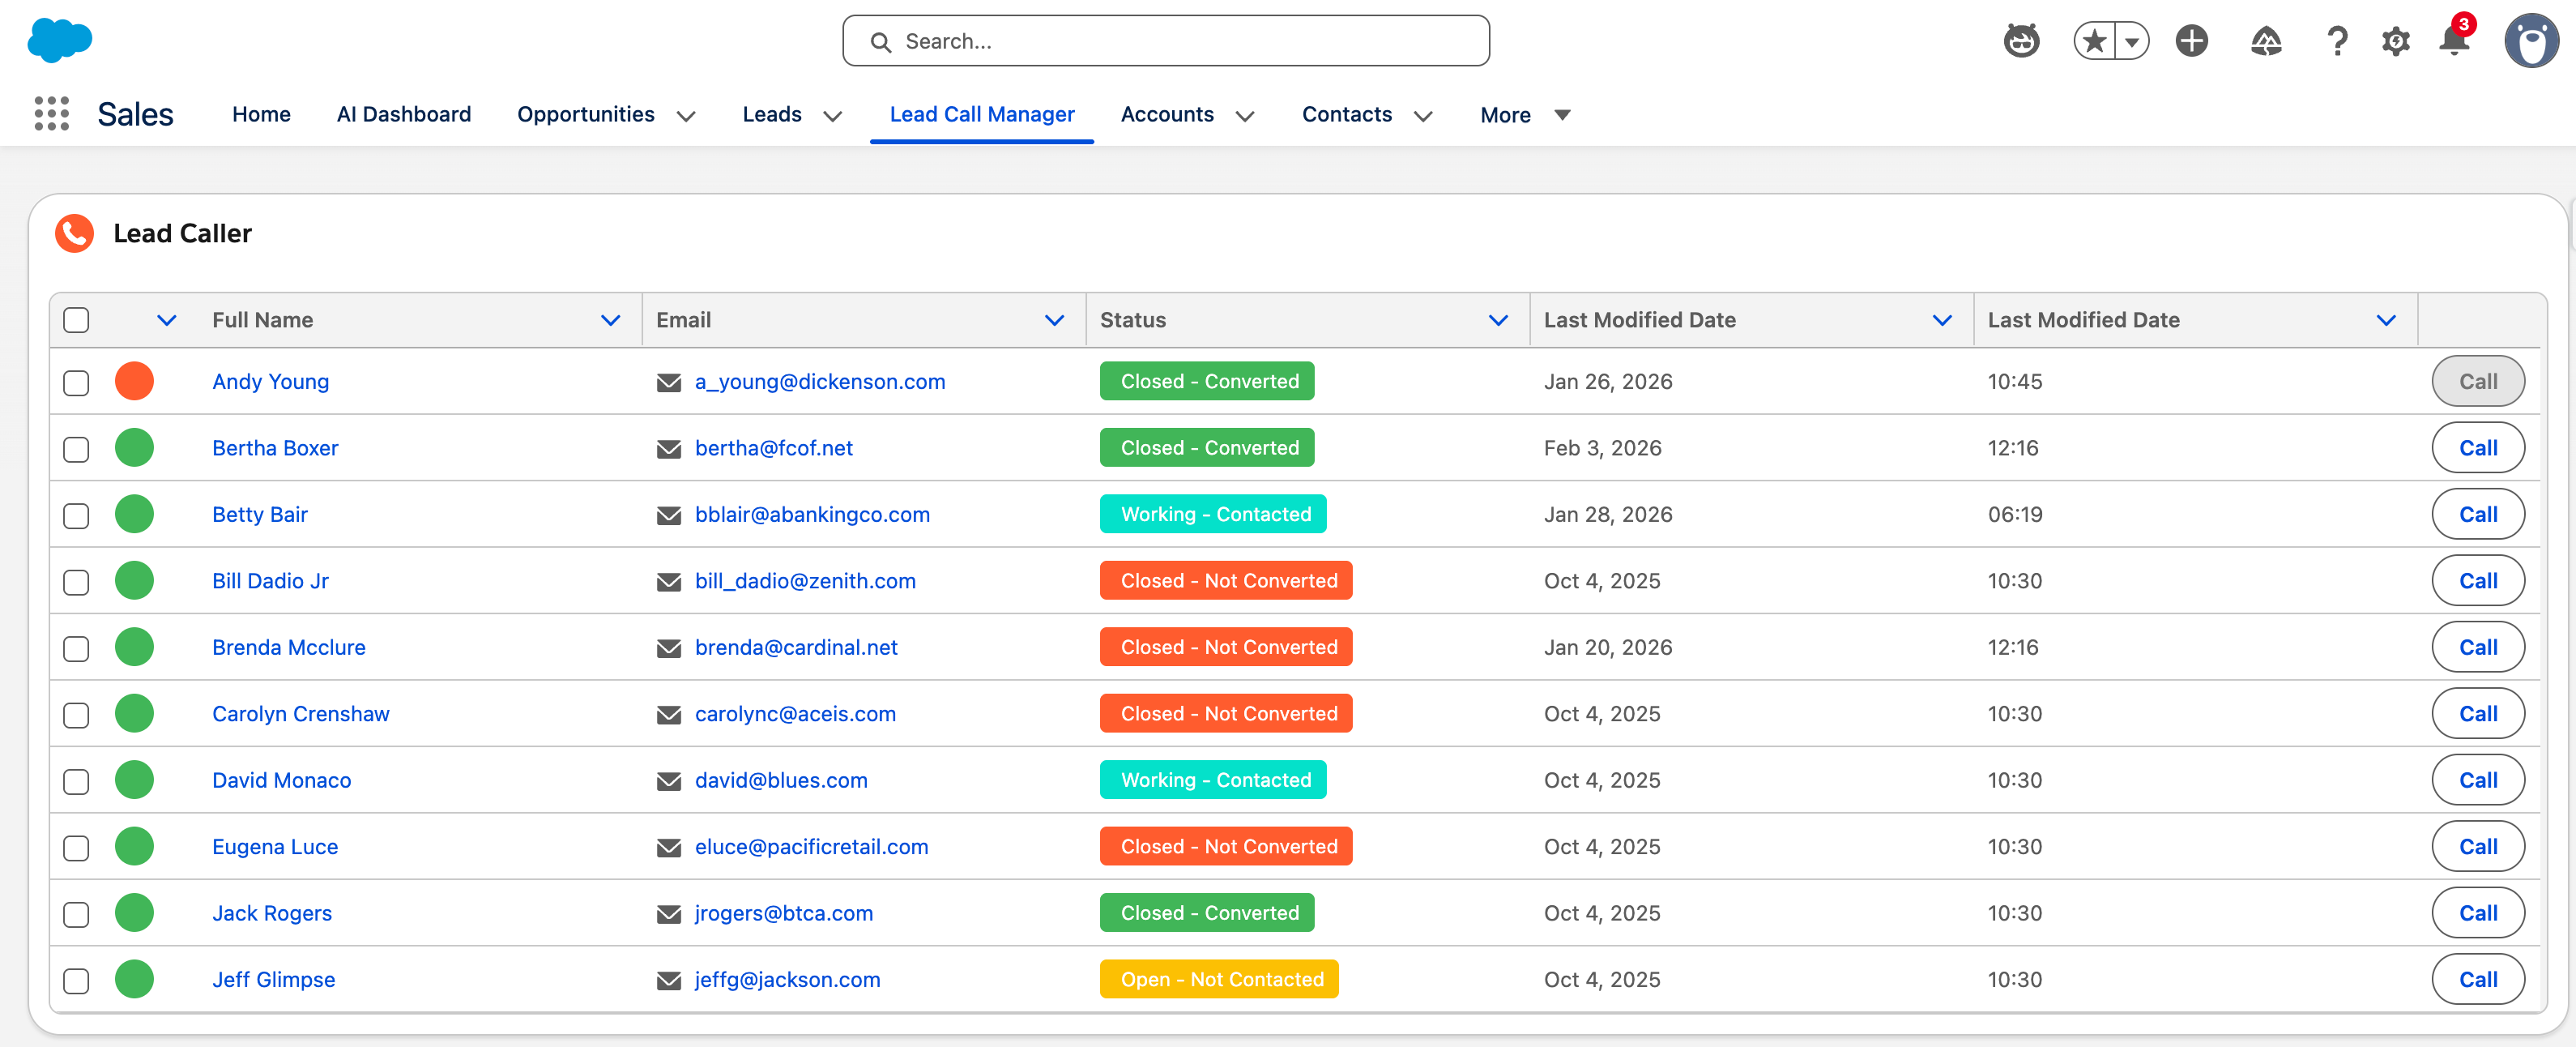
Actions and interactivity
This is an area worth paying attention to, because it shapes how users actually work with the table.
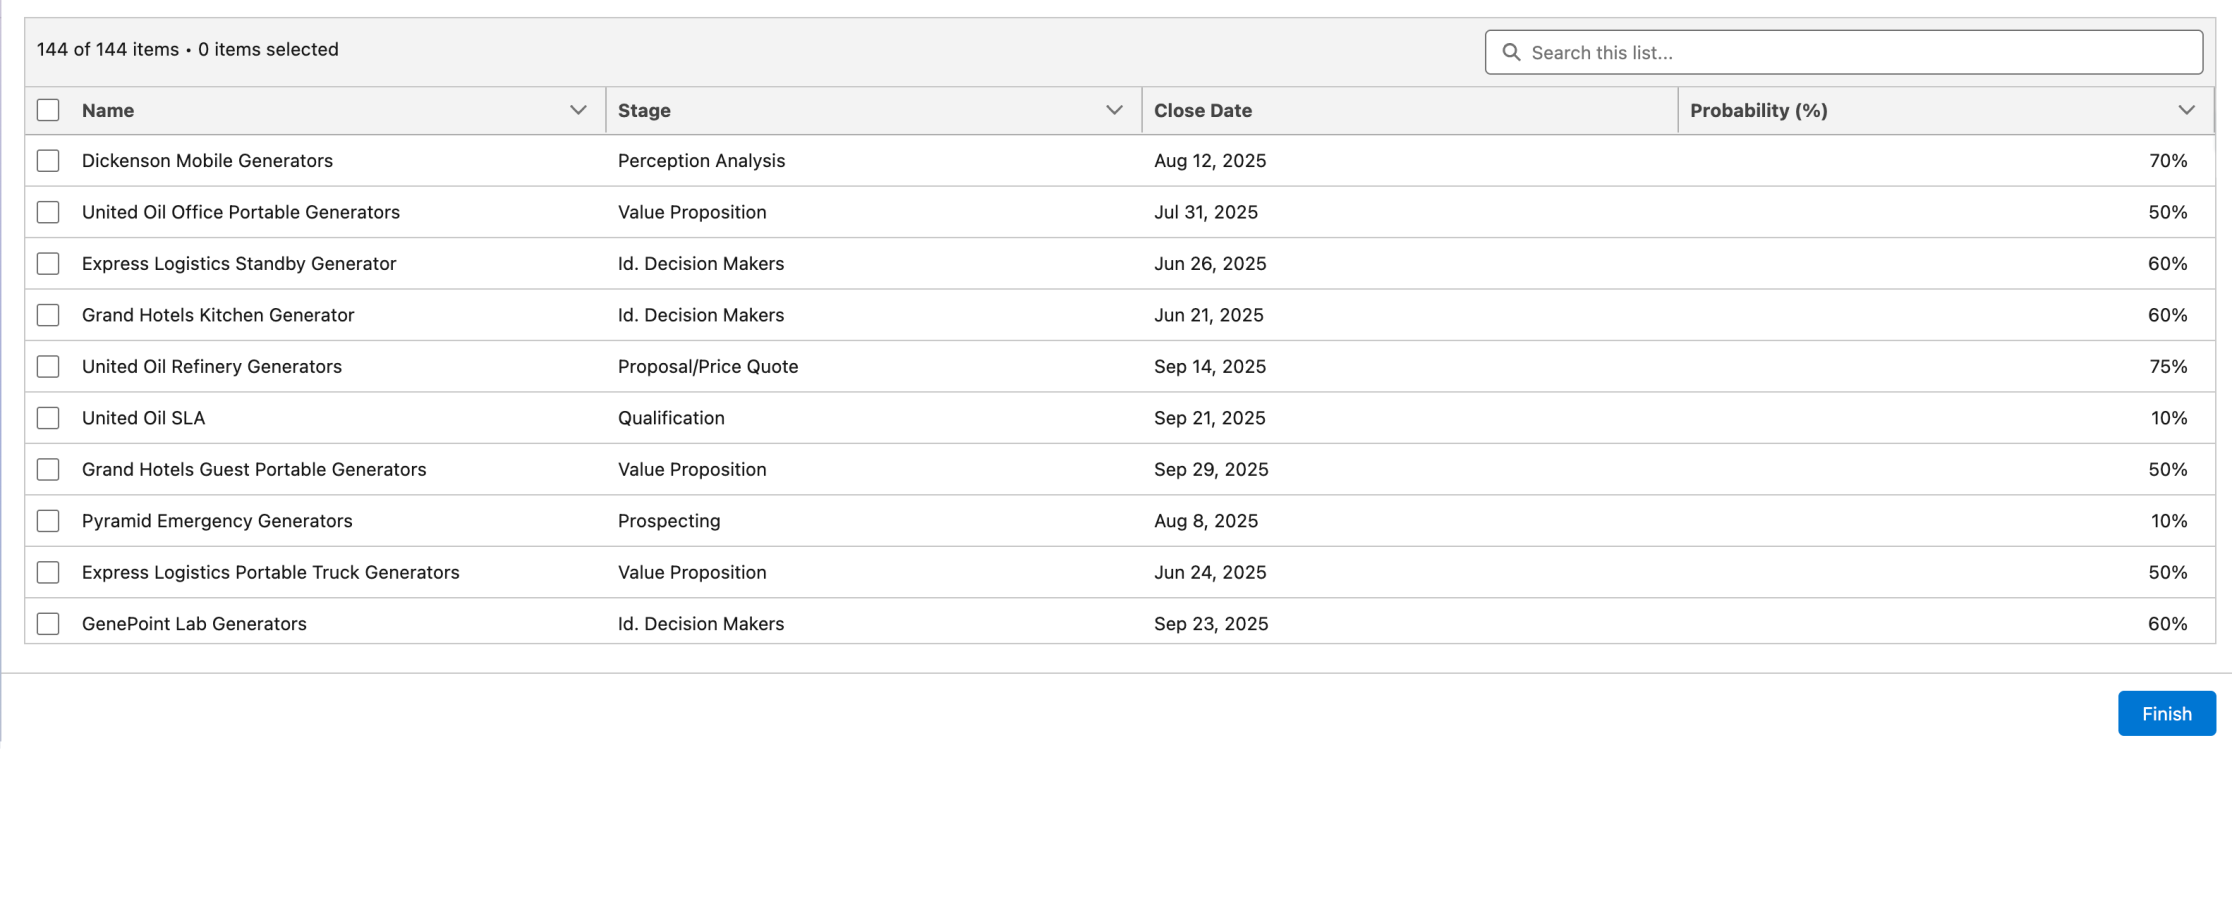
The standard Data Table supports row selection — multi-select, single-select, or view-only — and passes selected rows as output. For flows where the next step processes those selections, that's clean and simple.
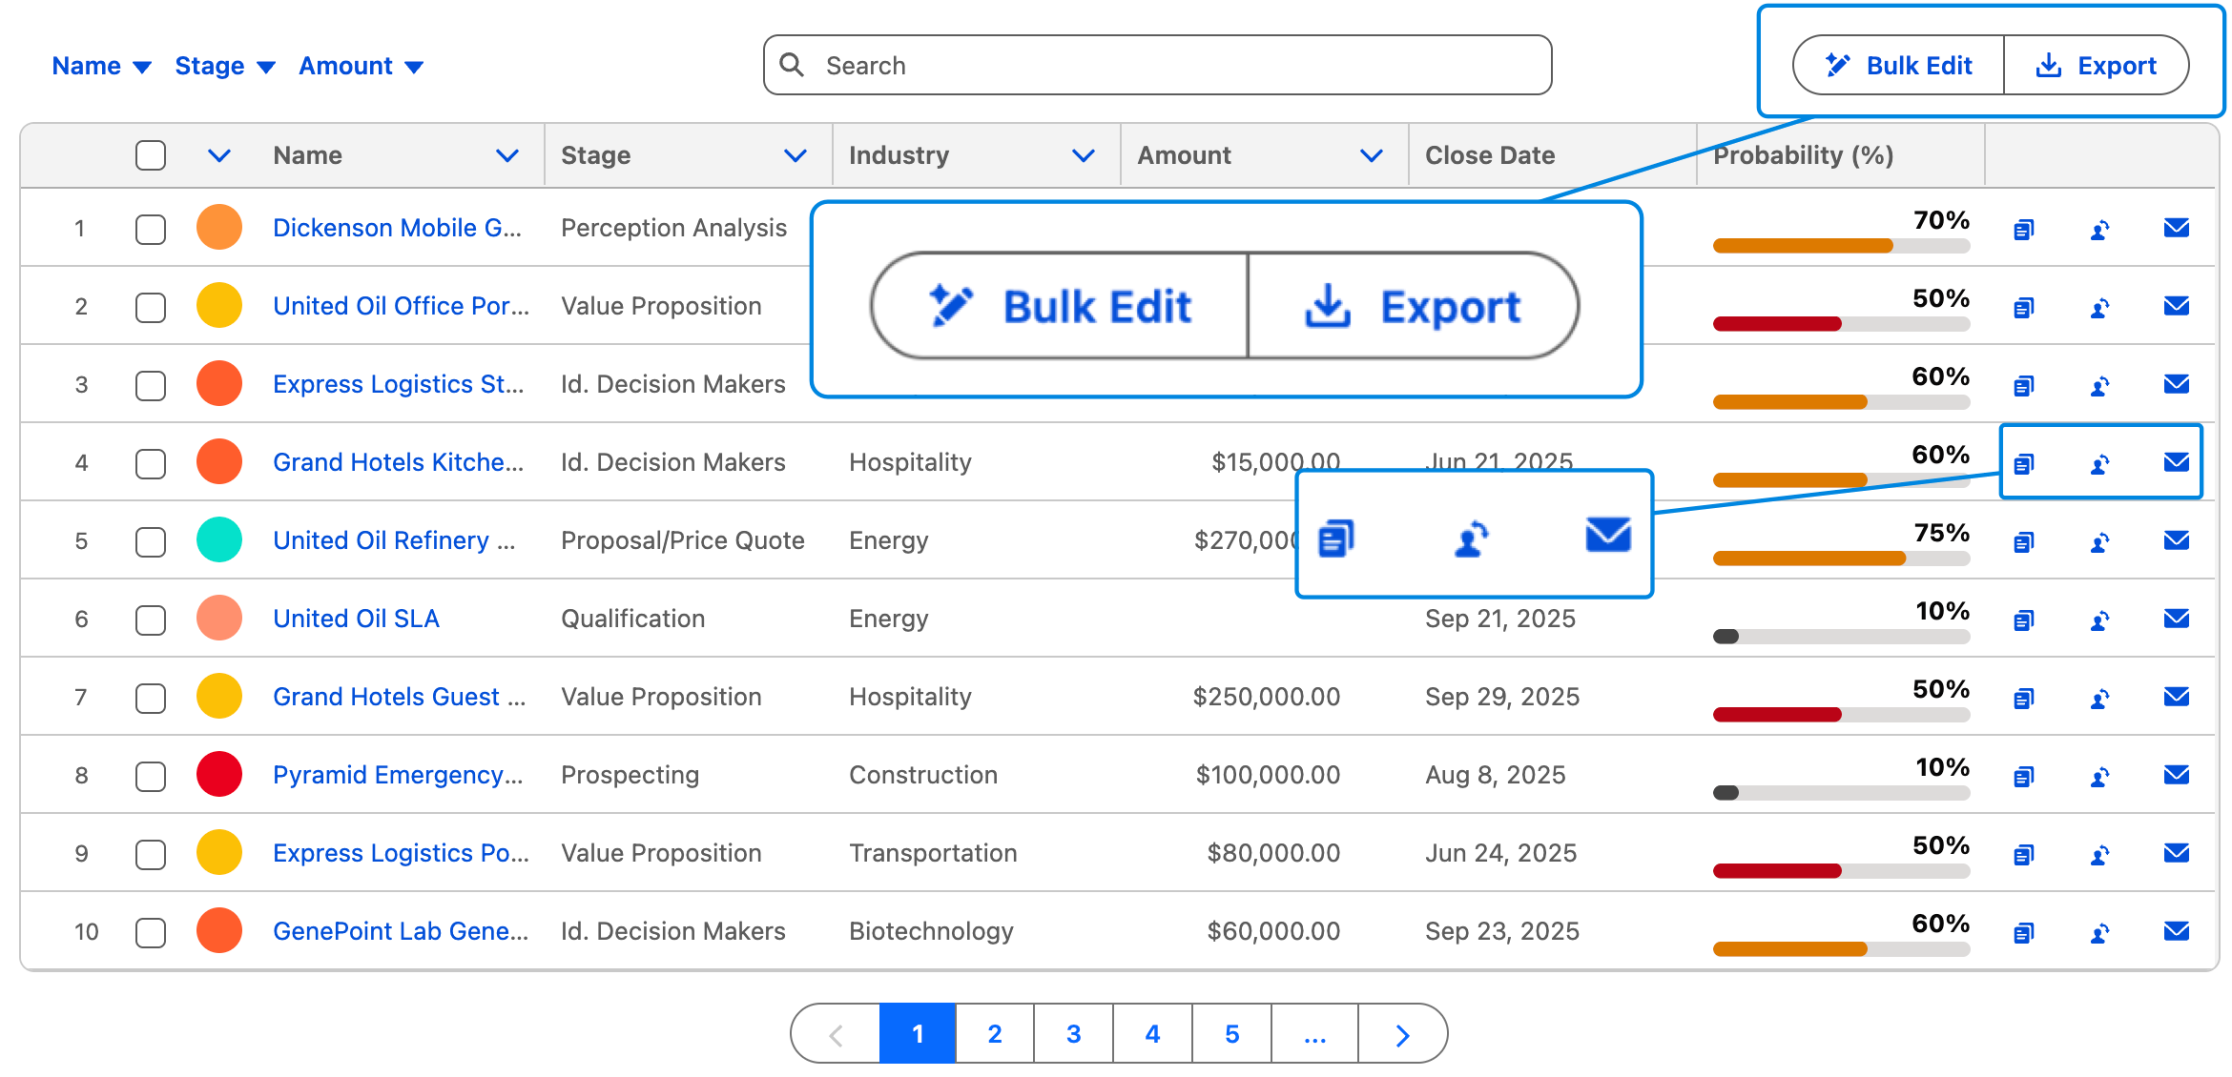
The Avonni Data Table extends this with a full interaction framework:
Per-row
Action buttons and menus
Edit, Delete, View Details, Launch Sub-Flow.
Header
Table-level buttons
Create New Record, Export to CSV, Bulk Update.
On click
Cell interactions
Update records, open a flow dialog, navigate to a page.
The distinction really matters when the data table is the primary interface — not just a step, but the place where users spend their time. When users can take action directly from the table, they don't need to leave it. That changes everything about the workflow.
Bulk Edit, Export, Clone, Send Mail - every action your users reach for is right where the data is.
Worth knowing: If your users need to act on records — not just select them — row-level actions are a meaningful upgrade.
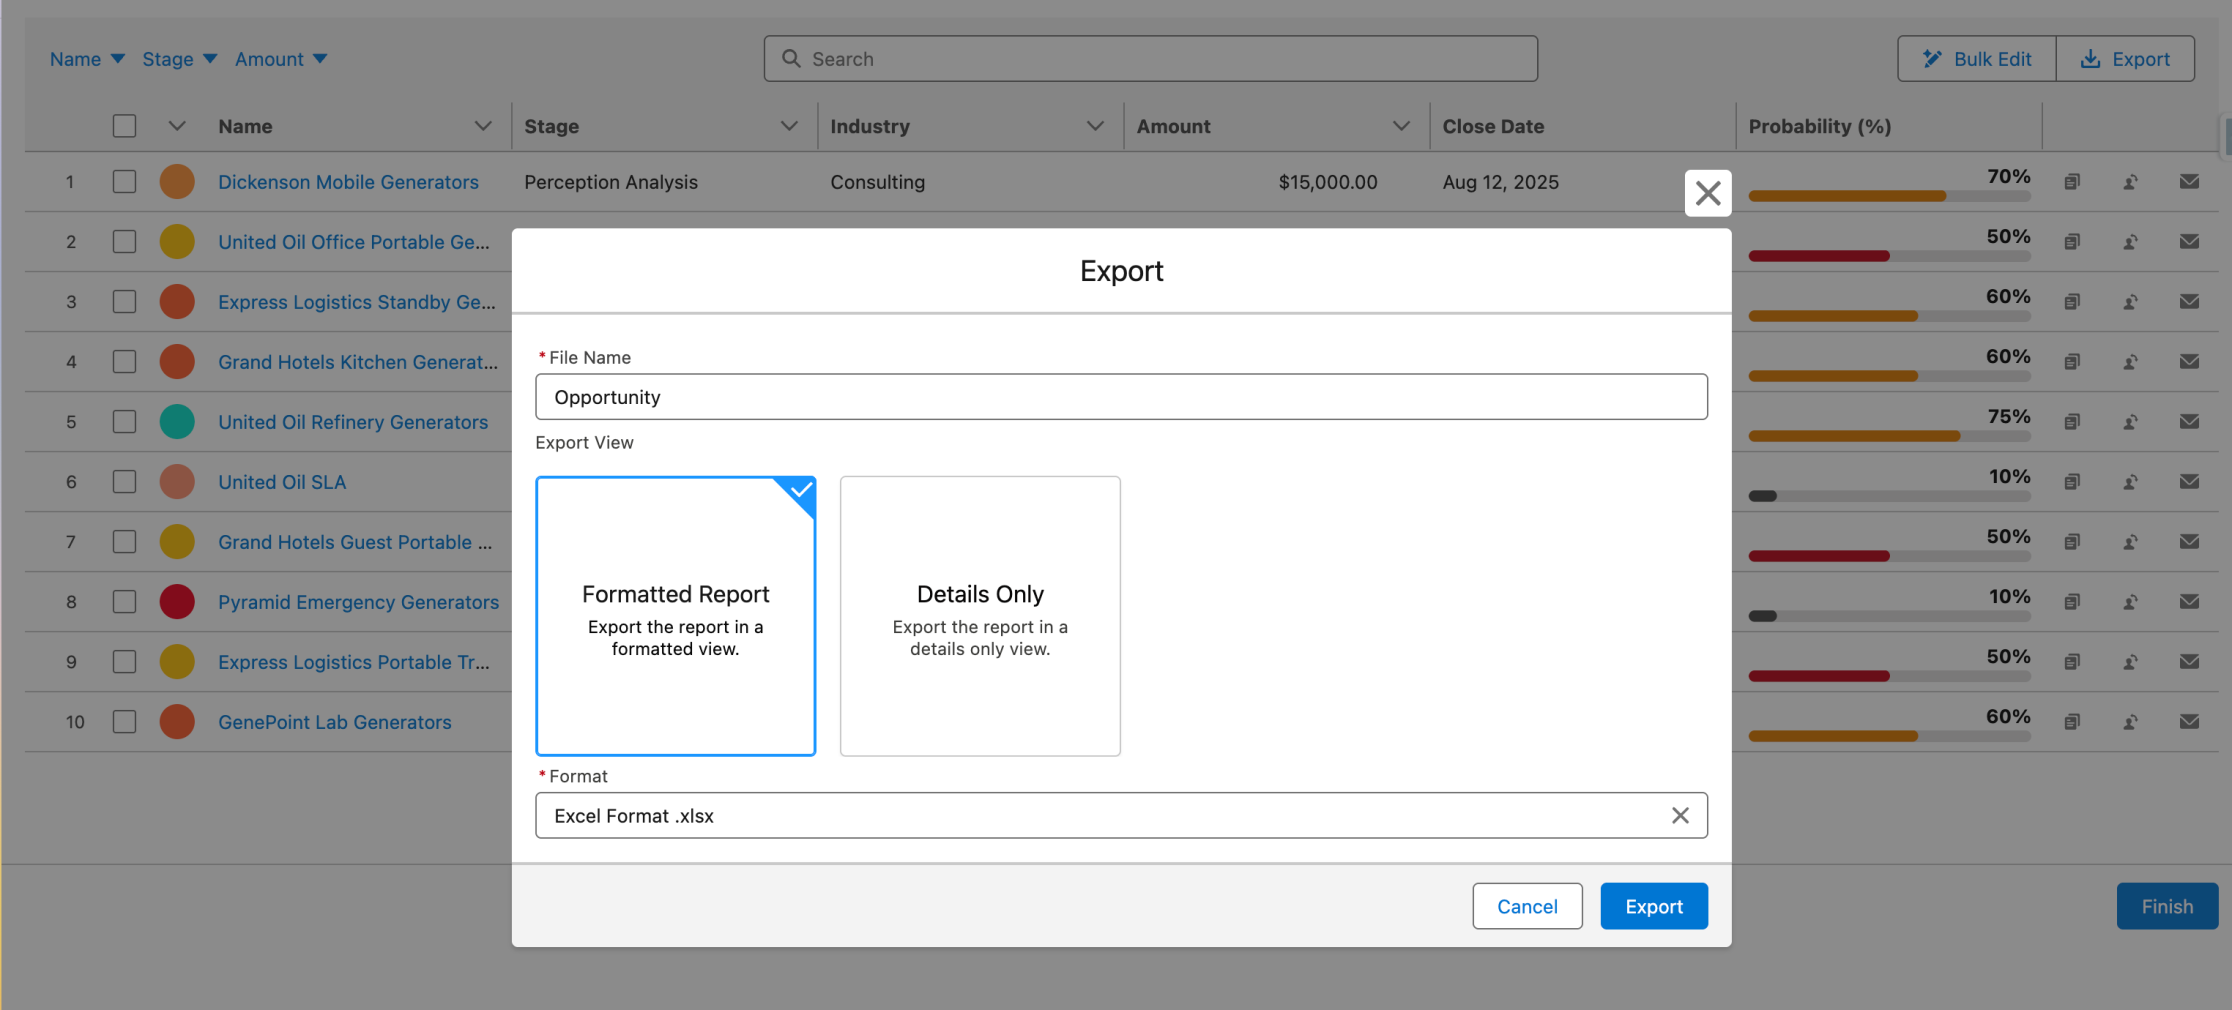
Data export
The standard Data Table doesn't support export right now. Avonni includes built-in CSV export — a straightforward feature that comes up a lot in operational workflows where users need to move data into a spreadsheet for reporting or sharing.
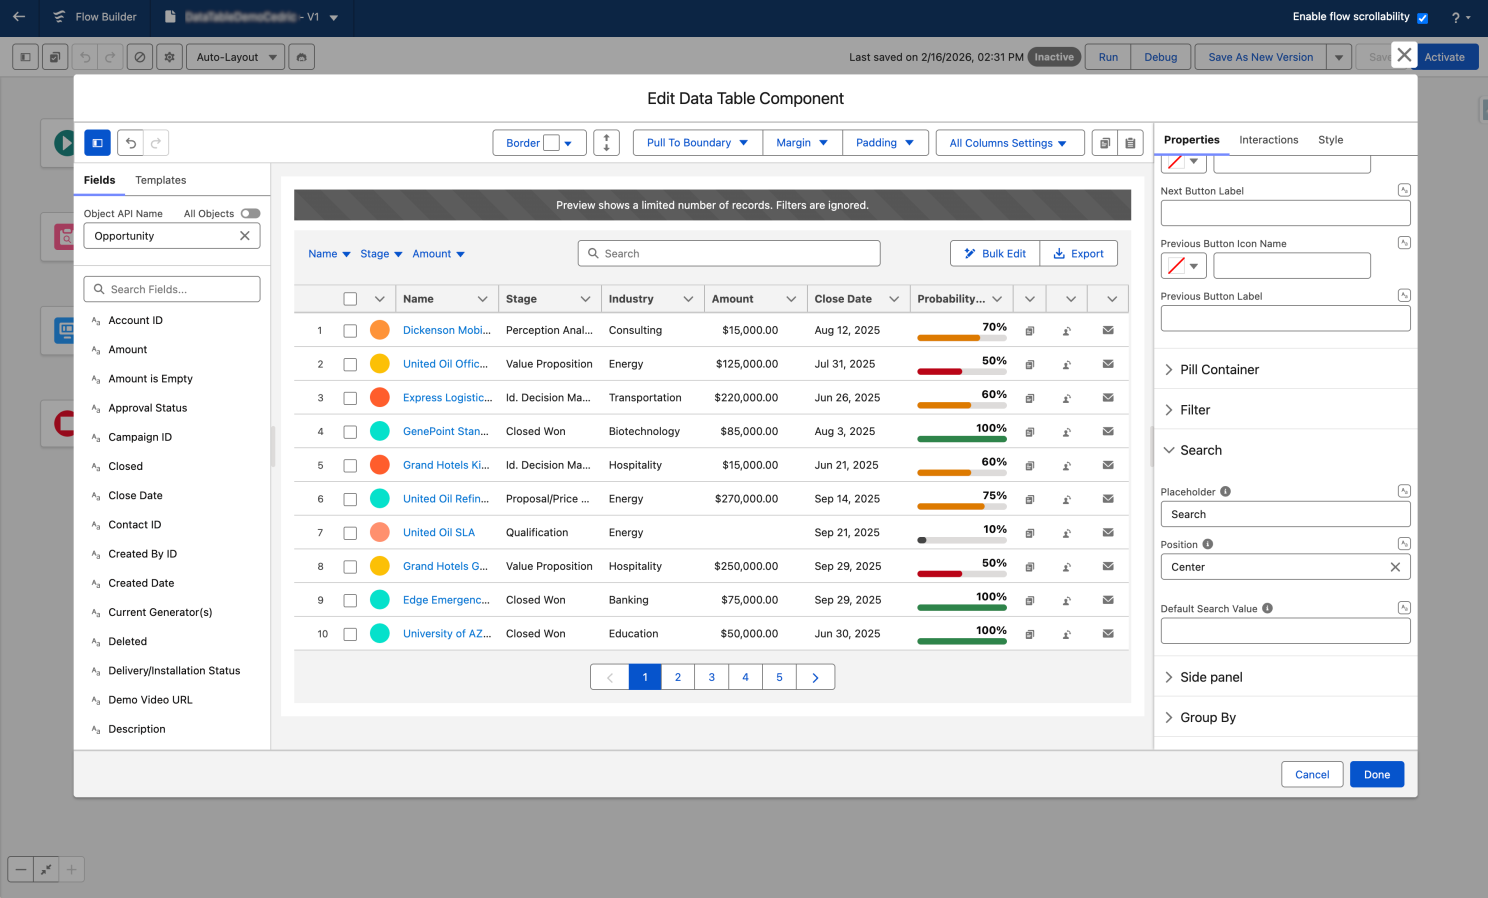
Configuration experience
The standard Data Table is quick to set up: drag it onto a screen, point it to a collection, and pick columns. Simple and familiar. The one limitation is there's no real-time preview — you configure the flow and then run it to see the results.
Avonni's Visual Component Builder gives you drag-and-drop configuration with a live preview. You see the table as you build it. It also supports reusable templates, which help teams standardize configurations across multiple flows.
For simple tables, the standard setup is perfectly fine. For complex tables with many columns, display types, and actions, a visual builder with live feedback cuts down the back-and-forth.
Configure and see - not configure and guess
Worth knowing: The more complex your table, the more time a real-time builder saves you.
Row presentation and formatting
Some details that matter when users work in these tables every day:
Avonni supports row numbers, a record count in the header, and a selected count indicator — small touches that help users stay oriented in large datasets.
Column alignment and default width controls give admins layout precision. Number and currency columns support configurable formatting — fraction digits, step values, significant digits — so financial data renders consistently.
The standard component provides a clean, minimal presentation without these formatting controls.
Before you choose: architecture matters
One thing we always tell our customers: use the right tool in the right context.
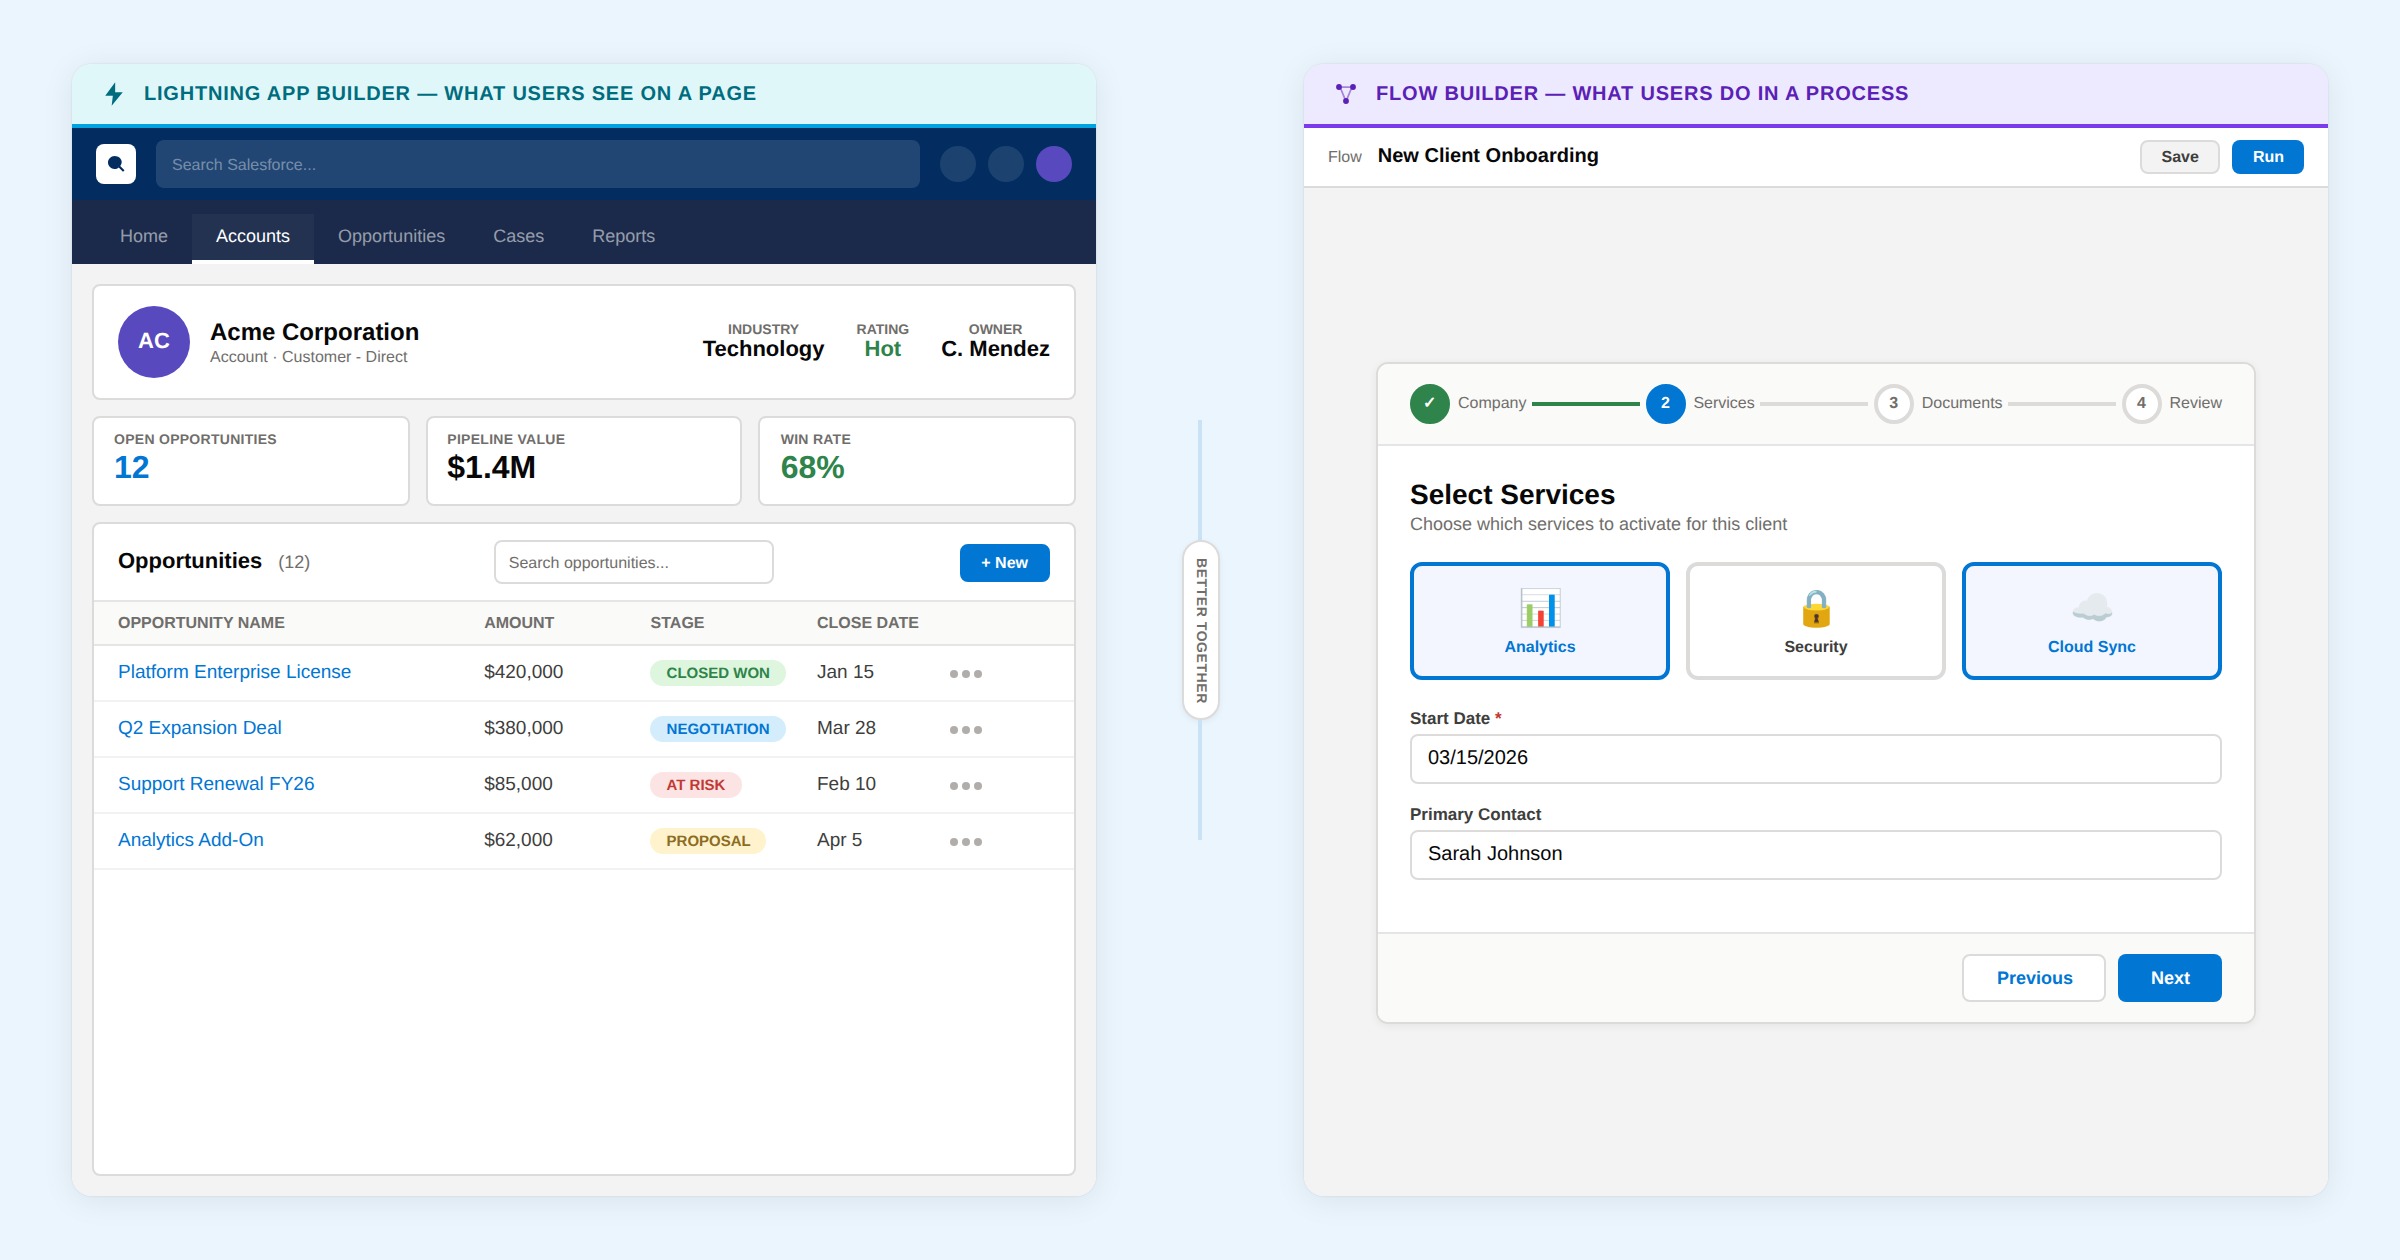
If your goal is to display a rich data table on a Lightning record page or home page — and it's not part of a multi-step flow — embedding a Screen Flow just to host a table adds unnecessary overhead.
Use a Screen Flow when…
It's a guided process
Wizards, data capture, bulk editing, multi-step workflows where the table is one part of the journey.
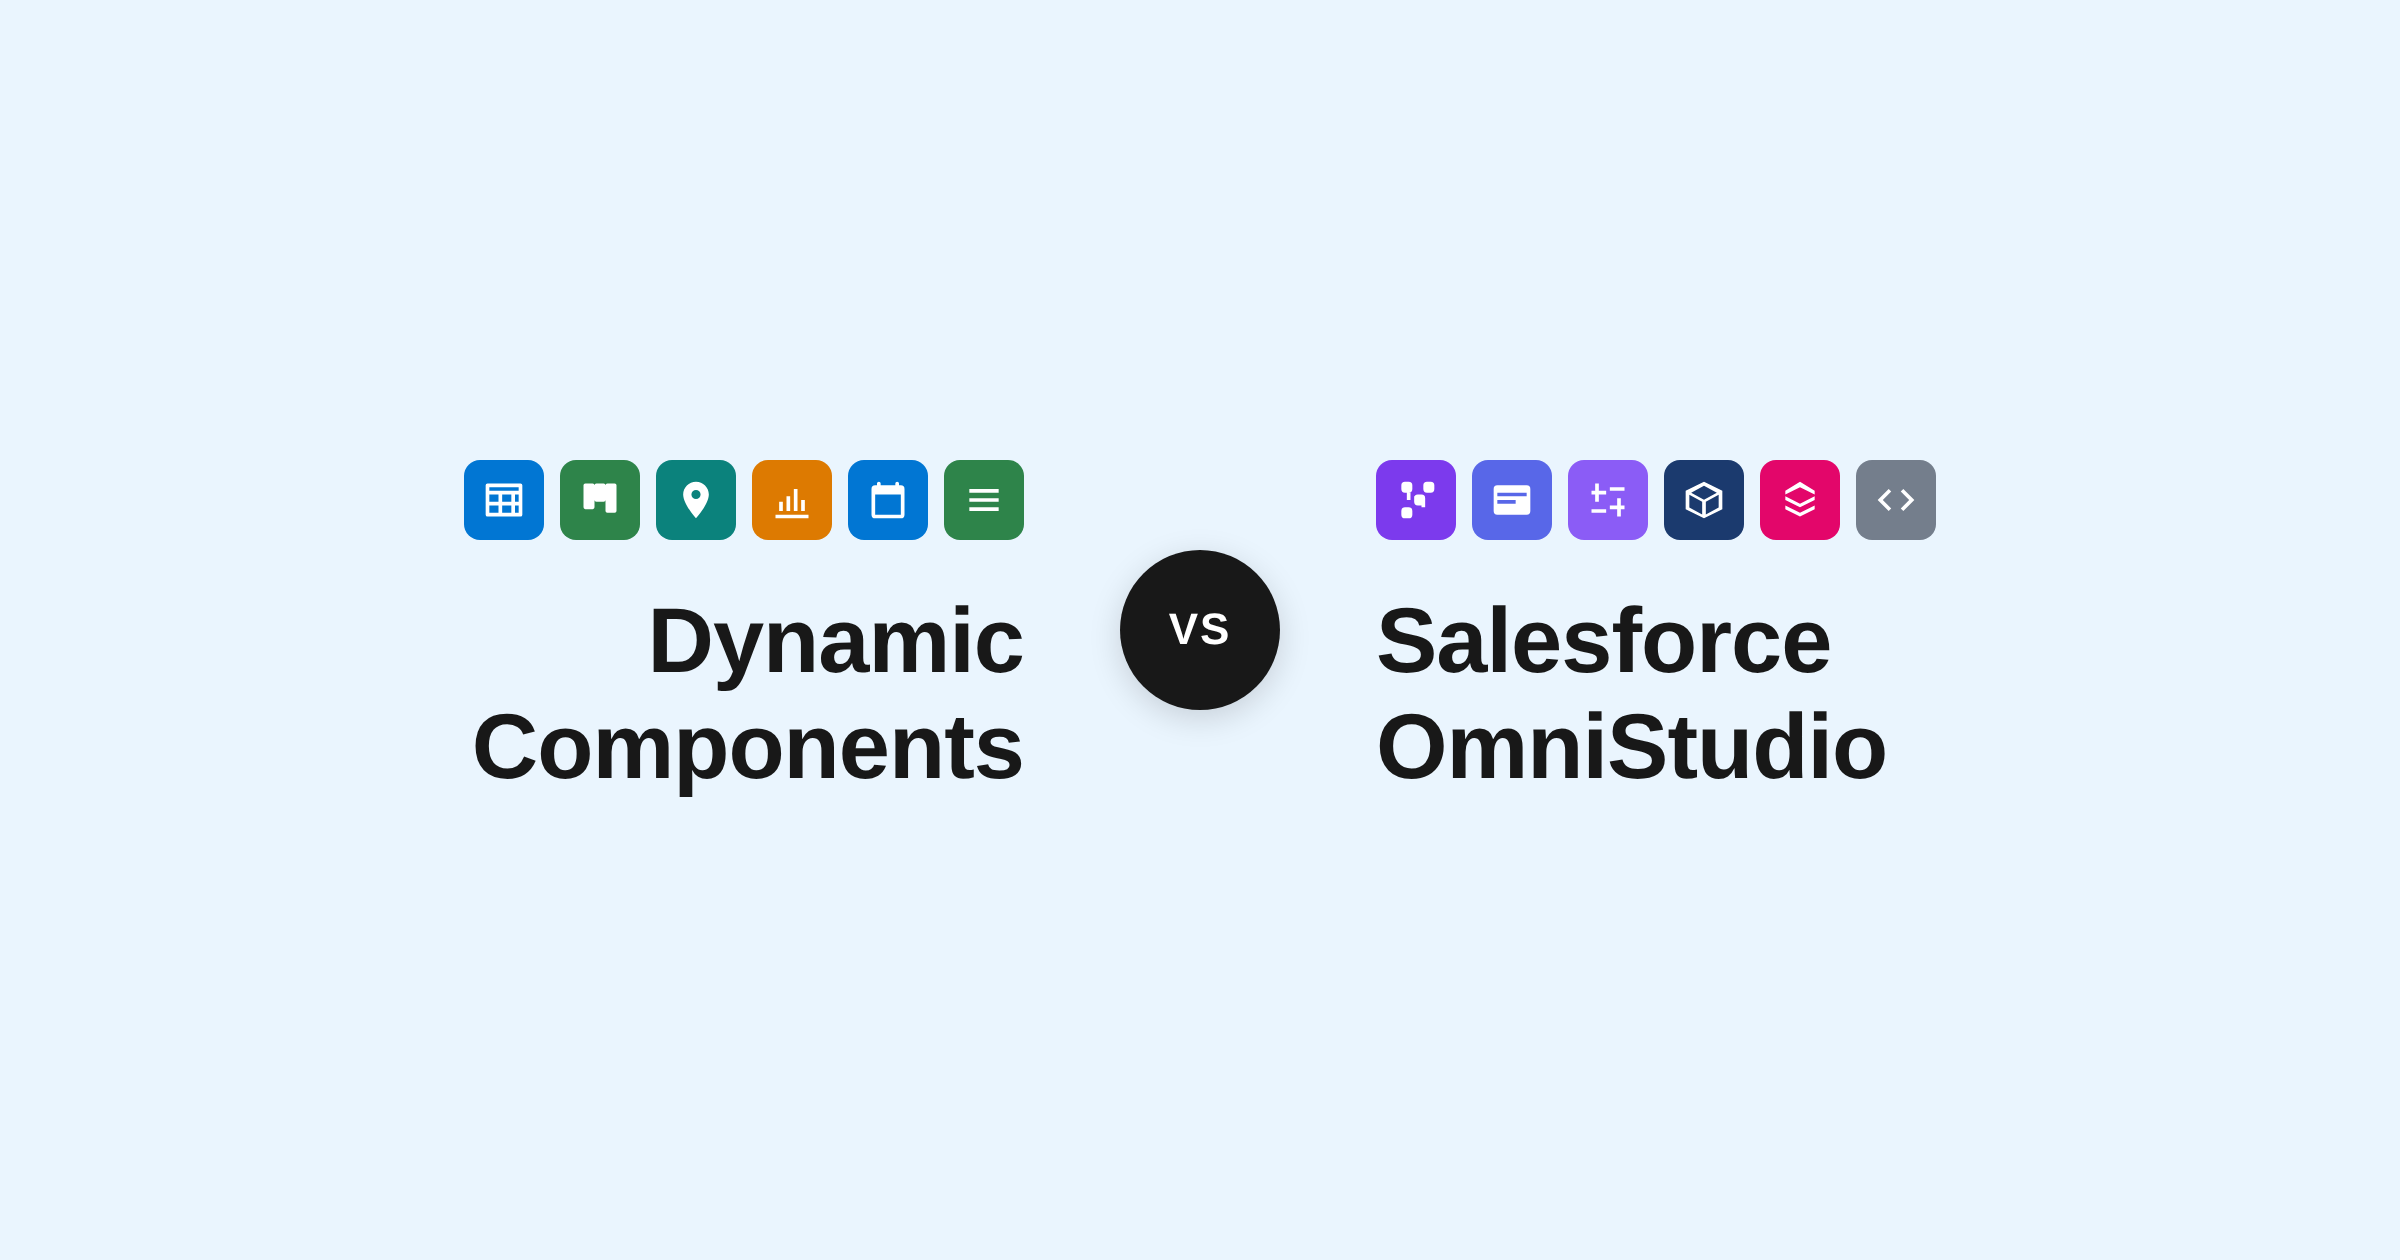
Use Dynamic Components when…
It's a standalone table
A rich data table on a Lightning record page or home page. No flow wrapper, full reactivity, drop directly in App Builder.
Save Screen Flow data tables for what they excel at: data capture, bulk editing, and multi-step workflows where the table is one part of a guided process.
Let's talk about the elephant in the room
Yes, Avonni is a paid managed package. You're already paying a lot for Salesforce — we get it, and it's a fair concern.
Three things worth knowing:
First, it's free for orgs with fewer than 10 users. No trial, no time limit — full access.
Second, you're not paying for a data table. You're getting access to over 75 flow screen components — schedulers, steppers, kanban boards, rich forms, file uploaders, and dozens more. Each one is built with the same depth as the Data Table we've discussed here. It's an entire UI toolkit for Screen Flows.
Third — and this is the one that matters most — the real ROI isn't in what you save on development. It's in what your users save every day.
Service agent
10–15 min→2 min
Updating 20 cases after a call blitz, with inline editing and row-level actions.
Sales manager
20 min→5 min
Reviewing 50 opportunities, with color-coded badges and conditional formatting.
Ops team
1 hour→15 min
Processing 100+ inventory adjustments weekly, with inline date and number editing.
These aren't edge cases. These are on Tuesday morning.
When you do that math for your own team, the ROI usually answers the pricing question on its own. The investment isn't in software — it's in your team's daily experience on Salesforce.
Free for orgs under 10 users — no trial period, no expiration. Full access, from day one.
The standard Data Table is a solid component that continues to improve. Spring '26 is the most significant update since launch, and Salesforce is clearly investing in its evolution. For flows where you need to display records, allow basic edits, and pass selections downstream — it's a capable, zero-cost option with no dependencies.
The Avonni Data Table exists because we've spent years listening to admins who needed more — rich visual formatting, editing across all field types, row-level actions, built-in filtering, conditional formatting, data export, and a real-time builder. These aren't theoretical features; they're solutions to problems our customers face every day.
Standard
Salesforce Data Table
✓Inline editing for text, email, phone, number, currency, percent, checkbox
✓Column sorting and global search
✓Row selection passed downstream
✓Free, native, no dependencies
Avonni
Data Table + 75 components
✓25+ display types and conditional formatting
✓Inline editing for every field type, including dates, picklists, lookups
A stronger native component raises the bar for everyone — including us. It pushes us to keep building what admins need next.
This comparison is meant to give you an honest picture, not a sales pitch. Both tools have their place. The key is knowing what each one actually offers before you commit your next flow to it.
If Avonni sounds like the right fit — or if you just want to see what 70+ components look like inside your own org — installing from the AppExchange takes about two minutes.


%20(Vignette%20YouTube)%20(81).png)
%20(Vignette%20YouTube)%20(78).png)
%20(Vignette%20YouTube)%20(79).png)
%20(Vignette%20YouTube)%20(11).png)
%20(Vignette%20YouTube)%20(10).png)